Quantcast
Channel: Hacker News
Viewing all 25817 articles
Browse latest View live

Console.table()

$
0
0

Displays tabular data as a table.

This function takes one mandatory argument data, which must be an array or an object, and one additional optional parameter columns.

It logs data as a table. Each element in the array (or enumerable property if data is an object) will be a row in the table.

The first column in the table will be labeled (index). If data is an array, then its values will be the array indices. If data is an object, then its values will be the property names. Note that (in Firefox) console.table is limited to displaying 1000 rows (first row is the labeled index).

Collections of primitive types

The data argument may be an array or an object.

// an array of strings

console.table(["apples", "oranges", "bananas"]);

// an object whose properties are strings

function Person(firstName, lastName) {
  this.firstName = firstName;
  this.lastName = lastName;
}

var me = new Person("John", "Smith");

console.table(me);

Collections of compound types

If the elements in the array, or properties in the object, are themselves arrays or objects, then their elements or properties are enumerated in the row, one per column:

// an array of arrays

var people = [["John", "Smith"], ["Jane", "Doe"], ["Emily", "Jones"]]
console.table(people);

Table displaying array of arrays

// an array of objects

function Person(firstName, lastName) {
  this.firstName = firstName;
  this.lastName = lastName;
}

var john = new Person("John", "Smith");
var jane = new Person("Jane", "Doe");
var emily = new Person("Emily", "Jones");

console.table([john, jane, emily]);

Note that if the array contains objects, then the columns are labeled with the property name.

Table displaying array of objects

// an object whose properties are objects

var family = {};

family.mother = new Person("Jane", "Smith");
family.father = new Person("John", "Smith");
family.daughter = new Person("Emily", "Smith");

console.table(family);

Table displaying object of objects

Restricting the columns displayed

By default, console.table() lists all elements in each row. You can use the optional columns parameter to select a subset of columns to display:

// an array of objects, logging only firstName

function Person(firstName, lastName) {
  this.firstName = firstName;
  this.lastName = lastName;
}

var john = new Person("John", "Smith");
var jane = new Person("Jane", "Doe");
var emily = new Person("Emily", "Jones");

console.table([john, jane, emily], ["firstName"]);

Table displaying array of objects with filtered output

Sorting columns

You can sort the table by a particular column by clicking on that column's label.

Syntax

console.table(data [, columns]);

Parameters

data
The data to display. This must be either an array or an object.
columns
An array containing the names of columns to include in the output.

Specifications

Browser compatibility

FeatureChromeEdgeFirefoxInternet ExplorerOperaSafari
Basic support Yes1334 No Yes Yes
FeatureAndroid webviewChrome for AndroidEdge mobileFirefox for AndroidOpera AndroidiOS SafariSamsung Internet
Basic support ? ? Yes34 ? ? ?

Windows NTFS Tricks Collection

$
0
0

TRICK 1: CREATE FOLDERS WITHOUT PERMISSIONS (CVE-2018-1036/NTFS EOP)

On Windows you can assign “special permissions” to folders like permissions that a user is allowed to create files in a folder, but is not allowed to create folders.

One example of such a folder is C:\Windows\Tasks\ where users can create files, but are not allowed to create folders:

Moreover, it’s possible that an administrator or a program configures such permissions and assumes that users are really not allowed to create folders in it.

This ACL can be bypassed as soon as a user can create files. Adding “::$INDEX_ALLOCATION” to the end of a filename will create a folder instead of a file and Windows currently doesn’t include a check for this corner case.

As shown above, a directory was successfully created and the user can create arbitrary files or folders in this directory (which can lead to privilege escalation if an administrator/program assumes that this is not possible because of the missing permissions).

Side note: The ::$INDEX_ALLOCATION trick can also be used to delete directories if an application just allows to delete files.

Contact timeline:

2018-03-01:Initial contact via secure@microsoft.com. Sending PGP encrypted blogpost.
2018-03-01:Microsoft assigned MSRC Case 43968 CRM:0461039882
2018-03-05:Microsoft asks to extend the disclosure deadline.
2018-03-05:Agreed upon the extended 90 days deadline.
2018-03-27:Asked Microsoft if the vulnerabilities could be reproduced and when a patch will be available.
2018-03-28:Microsoft confirmed that the “trick 1” vulnerability was successfully reproduced and assigned CVE-2018-1036. The vulnerability will be fixed by 5B (May Patch Tuesday).
2018-04-27:Microsoft contacted us that the proposed fix lead to a regression. Microsoft asked to extend the deadline to 2018-06-12 (June Patch Tuesday).
2018-04-30:Informed Microsoft that the deadline gets extended to 2018-06-12. Asked Microsoft if the other tricks will also be patched.
2018-04-30:Microsoft responded that the other tricks “will not receive a downlevel security update”.
2018-06-12:Microsoft releases the patch (see release here)
2018-06-13:Blog post release.

TRICK 2: BYPASS PATH RESTRICTIONS WITH ALTERNATE DATA STREAMS

You maybe wonder why the above technique worked. Basically files on a NTFS volume are stored in the form:

<filename>:<stream-name>:<type>

If we create a file named test.txt it will internally be stored as test.txt::$DATA because the stream name is empty and $DATA is the default type. The first trick abused the fact that the type can be changed to INDEX_ALLOCATION which corresponds to the directory type and therefore creates a directory.

However, it’s also possible to store data in a different stream (then this is called Alternate Data Stream – ADS). If we write for example to “test.txt”, we write in reality to “test.txt::$DATA” (the stream name is empty). However, we can also write to “test.txt:foo” or to “test.txt:foo:$DATA” (both are equal because $DATA is the default type). Different stream names are for example used to store the origin of a file. If you download a file from the internet (or receive it via e-mail), Windows silently adds a Zone Identifier via a stream name (then it can show an additional warning dialog if you want to execute it). For example, if we download “putty.exe”, Windows also creates “putty.exe:Zone.Identifier:$DATA”. These stream names can be made visible via the /r switch with the dir command:

As you can see, the Zone Identifier can’t be read via the type command (with the more command it would work) and it’s also important to omit the $DATA type if we read the file with notepad. The important message is that we can store data in an ADS (including applications!). For example, putty can be copied to an ADS and then be invoked via wmic (direct invocation is not possible):

Side note: This article was written on 2018-03-01 and reported to Microsoft. In the meantime Microsoft Windows Defender was updated to detect WMIC process invocations.

You maybe ask yourself why someone would do this? First of all, ADS can be used to hide data (dir command without the /r switch will not display them; explorer.exe will also not show them; We will later see how we can even hide from the /r dir switch…). However, ADS has another great property – we can add an ADS to a folder. To be allowed to do this we must own the “create folders” permissions on the directory (and the folder name must not be a number). The important fact is that an ADS on a folder looks like a file from the parent folder!

For example, on Windows a normal user can’t create files in C:\Windows\ (only admins can write to this folder). So it’s possible that applications assume that files in C:\Windows\ can be trusted because only admins can create such files. However, C:\Windows\Tracing is a folder in which normal users can create files and folders – a normal user can therefore create an ADS on this folder.

Let’s say the user writes to the file C:\Windows\Tracing:test.dll. If this path is now passed to a Windows API which calculates the base folder, this API will start at the end of the path and go backward until the first “\” is found. Then everything left from “\” will be returned as the base folder. For C:\Windows\Tracing:test.dll this will return C:\Windows\ as base folder, however, as already mentioned, a normal user is not allowed to create files in this folder but using this trick we created a file which looks like it is stored in C:\Windows!

Here is the output of different Windows functions which calculate the base folder (we can see that it’s always C:\windows):

Side note: The above stored dll can be started with the Windows built-in control.exe application with the command: control.exe C:\Windows\tracing:foobar.dll

This behavior can be used to bypass some application whitelisting solutions but can also bypass security checks in various situations where the programmer assumed that it’s enough to check if a file is stored in a specific base folder and assumes that only admins can write to this folder because of the set ACL.

For example, consider that an application allows to upload data and that uploaded data is stored in applicationFolder\uploadedData\. Moreover, the application allows to start scripts / applications from applicationFolder\ but not from applicationFolder\uploadedData\ (with a blacklist approach). If the user uploads a file named “:foo.ps1″, the system will create an ADS like applicationFolder\uploadedData:foo.ps1 and this file appears to be stored inside applicationFolder\ and therefore bypassing the security checks.

Another interesting fact is that ADS names can contain symbols which are normally forbidden for filenames like ” or * (you have to create these files using the native Windows API; cmd.exe filteres these characters):

This on it’s own can lead to several problems (e.g.: if the filename ends with ” and the path is enclosed by ” as mentioned by James Forshaw in his blog; see the references section). However, another interesting attack vector can be XSS (or command injection). Let’s assume that a website runs on IIS and allows to upload files and is prone to CSRF. After uploading the file a success dialog is shown including the filename. If the filename is not sanitized, this could lead to XSS, however, filenames are not allowed to contain symbols such as < or > (and we can therefore not execute JavaScript code with it). However, an ADS is allowed to contain these symbols, therefore an attacker could try to send an upload request for a filename with ADS:

TRICK 3: CREATE FILES WHICH CAN’T BE FOUND BY USING THE “…” FOLDER

Every folder contains per default two special entries, namely the directory “.” which refers to the current directory and “..” which referes to the parent directory. On Windows it’s not possible to create files / folders with just dots in the name, most likely to prevent attacks which confuse the parsers with the dots.

The screenshot above shows that it’s not possible to create a “…” or “….” folder. However, this can be bypassed with the above mentioned ::$INDEX_ALLOCATION trick:

The “…” folder was created with the above mentioned trick, however, such folders can also be created by passing the name twice as shown in the “….” example (mkdir “….\….\” creates the directory “….”, but also a directory “….” in it. Just passing mkdir “….\xyz\” doesn’t work.).

Using the second trick you can also enter these folders, store files there or even execute programs from this location:

As you can see, you can’t enter the folder with just the name (e.g.: “cd …” or “cd …\” or “cd …\…” is not working), so you really have to use the syntax “cd …\…\”. After that you can create files in this folder. (Interesting side note: If you enter “cd .” in this folder, you will go one directory up, because path’s are confused).

Moreover, it’s also not possible to open this directory from the GUI (explorer.exe). I encountered two different situations. In some cases double clicking such a folder has no impact (you stay in the current directory and the path keeps the same), in other cases you stay in the folder but the path in the explorer changes. For example, after “opening” the folder 17 times it looks like this (notice the “…” dirs in the path):

You can try to enter the folder as often as you want, you will not see the files in the folder in the GUI. It’s also not possible to open the folder by passing “C:\test\…\…\” in the path input field in the above image.

(Side note: If you try to delete this folder from the GUI, explorer.exe will crash; You will see a dialog where windows is counting files in the folder and where it counts “a lot of files”; Maybe it’s better if you don’t try this on your working system…).

Searching for files in this folder via the GUI (explorer.exe) also doesn’t work, for example, if you search for the “123.txt” file with the GUI it will hang/search forever, without actually finding the files.

Please note that searching via cmd works without a problem:

However, most people nowadays use Powershell and with Powershell you again can’t find the file because it will be stuck in an endless loop:

(Output is truncated because the command will print the two directories forever…).

A search for “123.txt” (E.g.: with “Get-ChildItem -Path C:\test -Filter 123.txt -Recurse -ErrorAction SilentlyContinue -Force”) will therefore never find the file (and will never end).

I also tested this with different AntiVirus products, these seem to work correctly (I placed malware samples in this directory and the tested AntiVirus solutions found them). Some of them were still confused by the path, e.g.: when searching for viruses inside “C:\test\…\” they searched in “C:\test\” instead. Also python code with os.walk() seems to work correctly.

Please note that just creating a directory junction which points to it’s own parent folder doesn’t lead to an endless loop in cmd or Powershell.

TRICK 4: “HIDE” THE DESTINATION OF A DIRECTORY JUNCTION

Directory junctions are a very useful NTFS feature to find security vulnerabilities for attackers. Using it you can create (with normal user privileges) a symbolic link to a destination folder.

The best security vulnerability to explain directory junctions is in my opinion AVGater, where the attacker places a file in folder x. Then he marks the file as a virus and the installed AntiVirus solution will move it into the quarantine. After that the attacker removes the folder x and replaces it with a directory junction named “x” which points to C:\windows\System32\. If the attacker now clicks on the “restore” button the AntiVirus solution will copy the file to the x folder which now points to system32 with SYSTEM privileges (which directly leads to EoP).

Directory junctions can often be abused if the targeted application contains race condition vulnerabilities (TOCTOU vulnerabilities – time of check time of use).

A directory junction can be created with the mklink utility together with the /J argument. It’s possible to combine this with the ::$INDEX_ALLOCATION trick to create a directory junction with the name “…”:

The first directory junction “test1” was created with a normal name and therefore the destination is correctly shown in the “dir” output. However, in the case of the “…” directory junction, the target is no longer displayed (instead […] is shown; see the red box). Please also note that you can let junction1 point to junction2 which points to junction3 and so on until the last one points to the actual destination.

Since the paths are confused, you can enter the junction with the above mentioned “cd …\…\” trick (to be in the system32 folder), but “.” will point to “C:\test8” instead:

The dir command prints files from the system32 folder (red marked; please also note that the first command created the hello.bat file in C:\test8\).

The red marked files are the last files from the system32 folder (last output of the dir command). In blue we can see that “hello.bat” from the current directory (“.\”) should be executed. Since the paths are confused, this will execute C:\test8\hello.bat (green box) and not C:\windows\system32\hello.bat. I’m not sure if this has a direct impact on the security since you can start files in any folder anyway, however, it could maybe be used to bypass application whitelisting solutions with whitelisted script files.

TRICK 5: HIDE ALTERNATE DATA STREAMS

As already discussed it’s possible to dump ADS via the /r switch in the dir command. Moreover, streams.exe is a tool from Sysinternals which can also dump the streams:

On older versions of Windows it was possible to hide the ADS by using reserved names as base name (e.g.: CON, NUL, COM1, COM2, LPT1, …). However, on Windows 10 this seems to be fixed and is no longer possible, but “…” still works:

The ADS on “…” was successfully created, but isn’t listed by the tools. Creating an ADS on COM1 results in an error, the creation of an ADS on NUL doesn’t have any affect (ADS will not be created).

Please note that you can also create an ADS on the drive like “echo 123 > C:\:abc.txt”. This will hide from the “dir /r” command inside C:\. However, it will show the ADS inside subfolders of C:\ for the “..” directory. For example:

The red marked ADS was created by the C:\:abc.txt ADS. This ADS is also visible via Sysinternals tool streams.exe if it’s called directly on C:\. Therefore, to hide from both tools the “…” trick should be used.

There exists a second trick which can be used to hide from the tools. On Windows you can add “.<spaces>.” at the end of a file and Windows will automatically remove it (canonicalization removes it).

However, we can create such a file with an ADS! The funny property of such a file is that tools will not be able to open the file, because a path like “xyz. .” will automatically be changed to “xyz” and this file doesn’t exist.

Here is the proof:

The created ADS foobar.txt can’t be found by the tools:

Side note 1: Such files can also be created via: echo test > “test. .::$DATA”

Side note 2: Please note that the “..:abc.txt” ADS is the ADS which was created on “C:\:abc.txt”.

We can also create a directory with the name “. .” like this:

Then it’s not possible to enter this folder:

Moreover, the already mentioned technique (like cd . .\. .\ doesn’t work), but cd “. .::$INDEX_ALLOCATION” works (the double quotes are important).

If we can add spaces in between of a directory name, we can also add it at the end like “b ” or “.. ” or “. “.

Explanation: There is a “b” and a “b ” folder, a file named “a” and a file named “a “, the two default dirs “.” and “..” plus the “. ” and “.. ” ones and the “. .” dir.

Directories with the name “.. ” can be entered with our already discussed technique:

Side note 1: This folder can be opened via the GUI if you click twice on the folder, also the content of the folder will be displayed correctly. However, files in it can’t be opened because of the wrong path (explorer.exe uses C:\test22\.. \.. \123.txt instead of C:\test22\.. \123.txt). Powershell will again be stuck in an endless loop when searching such folders.

Side note 2: You can also create an ADS on a folder with a name such as “abc”. Then you can rename the folder to a name just containing numbers (e.g. “1”). After that you can still see the ADS, but you can’t open it (ADS on a folder with a number as name doesn’t work). To open the ADS data you have to rename the folder first back to for example “abc”.

FILESYSTEM TRICKS VS. ANTIVIRUS PRODUCTS / FORENSIC SOFTWARE:

I did a quick verification of the above mentioned tricks against AntiVirus products to verify if these can catch malware which abuses the tricks. The most noteworthy finding was with files / folders ending with “. .”. For example, I stored the eicar test virus in a folder and copied it with the following commands:

copy eicar.com > "123. .::$DATA"
copy eicar.com > tester 
echo 123 > "foo. .::INDEX_ALLOCATION" 
cd "foo. .::$INDEX_ALLOCATION" 
copy ..\eicar.com . 
copy ..\eicar.com .\eicar

After that I re-enabled the AntiVirus solutions and scanned the folder. All AntiVirus solutions just identified “eicar.com” and “tester” in this folder, but not the eicar virus in “123. .” or in the two files in the “foo. .” folder. However, when this folder is entered and the files are started, the AntiVirus products found them (because the content is loaded from the file system to memory). The “remove” action from Windows Defender could not remove the files and has therefore no impact, however, the “remove” action from for example Emsisoft could remove the test virus in the folder. Emsisoft just removed the “eicar.com” file in the “foo. .” folder, the “eicar” file was not removed and the content can be read without a problem (Emsisoft responded to us that only files which are mapped as executable are scanned with the exception of some specific file extensions like .com. This behavior can be altered in the file guard settings by switching to “Thorough” to also scan at file reads; Windows Defender on the other hand also blocked reading the “eicar” text file).

I also conducted a short test against Autopsy 4.6.0 (a free forensic software) by loading “logical files” into the tool (from the running system; not a disk image). The “…” folder can be entered, however, the “foo. .” folder can’t. Moreover, I created a file named “valid” with the content “valid” and a file called “valid. .” with the content “secret”. Autopsy shows for both files the content “valid” (and never the “secret” content). In addition to that, the “.. ” folder (with a space at the end) is intepreted as “..” and therefore goes one directory up at double click. This only applies to the “logical files” mode, in disk image (raw) mode, everything is displayed correctly (in the live mode Autopsy is using the Windows API to access the data and therefore problems occur).

TRICK 6: HIDING THE PROCESS BINARY

As already discussed above: Windows automatically removes “. .” at the end of a file. What if we can somehow start a process with a name like “file1. .”? Well, then it can happen that checks (e.g.: signature checks from AntiVirus products) are maybe performed on “file1” instead. Let’s try this:

We created 3 files:

  • “file” with the Microsoft signature from taskmgr
  • “file. .” which is our “fake malware” which should be hidden but executed
  • “filex x” which contains the signature from WinSCP. This file will become important later.

We now need a way to start a process from the “file. .” binary which is not a trivial task because all Microsoft Windows API calls automatically remove the “. .” from the filename and would start “file” (taskmgr) instead. To deal with this problem we use the following code:

The above code just calls CreateProcessA to create a process from “filex x” (WinSCP). If we compile this application and start it, WinSCP will be started. However, we are not going to start it normally. Instead, we start the application inside a debugger (e.g.: WinDbg). Now we set a breakpoint at the function which makes the associated system call: “bp ntdll!NtCreateUserProcess”. With “g” (go) we can start our program in the debugger and hit the breakpoint. At the breakpoint the current stack can be dumped (“dq rsp”). The 12th pointer on the stack is important and should be dumped. The 4th value at this address is the pointer to our file name.

The filename (green box) is now normalized (it starts with \??\C:\…). Exactly this normalization would had also remove the “. .” from the end of the filename – that’s why the above C-code didn’t use “file. .” as process name. However, since normalization already happend, this value can now be modified. Let’s overwrite the “x” characters with “.” (command “eb” for edit bytes):

After that just continue execution with “g”. Guess what will happen?

Correct, “file. .” (the malware) gets executed. However, if a user right clicks the process in the task manager and selects “properties” the properties of “file” (taskmgr) with the valid Microsoft signature will be shown.

But what is with “filex x” (WinSCP)? Yes, this file gets also shown as the running process namely in process explorer (because the path was set before NtCreateUserProcess was called):

And what is with powershell? Yes, also the wrong binary:

Is this a problem? Well, it depends. First of all, an attacker can start a process (the malware), rename / remove it afterwards and then rename a valid file to the same name. Then the above effects in taskmanager and process explorer will also occur. However, the difference is that with the above mentioned trick this happens exactly at the same time when the process gets launched.

For example, consider that the installed endpoint protection checks for every started process if the binary hash is already known in the cloud. With this trick the endpoint protection may use the wrong binary to verify if the hash is already known. Please also note that a debugger is not required to create such processes. An application can just hook the NtCreateUserProcess function and implement the modifications in the hook.

WINDOWS CMD TRICKS:

These tricks have nothing to do with file system tricks, however, I think they fit well in this blog post. In the Windows cmd it’s possible to write ^ at any location in the command and cmd will completely ignore it. For example, “calc.exe” is the same as “ca^l^c”. It’s just important that ^ is not the last symbol and that two ^ symbols are not used after each other. Instead of ^ the double quote can also be used and this has no restrictions (it can be the last character or used multiple times). For example, ^ca^”^”^lc^” will start the calculator.

The same applies to zero-length environment variables. An environment variable can be accessed via %name%. If the environment variable has a length of zero, “cal%name%c” would be the same as “calc”. Since environment variables don’t have per default a length of zero, this can’t be used directly. However, it’s possible to call substring on the environment variable with a special syntax (:~start,end). The following figure shows the “windir” environment variable and how substring can be used with negativ values to get a zero-length variable returned:

The following figure shows a combination of these techniques to hide that Powershell is started in version 2 (which was a long time helpful but should not be done anymore on latest Windows 10):

You can see the use of ^ and the environment variable trick (%os:~0,-56%), but also that the version “00000000002.0000” (instead of just 2) is used and that the argument is “?ver” and not “-ver” (note, this is not a normal ? symbol, it’s U+2015; just using ? would not work).

On Windows “/” can also be used in paths instead of “\”. For example, C:\Windows/\//\system32\calc.exe is the same as C:\Windows\system32\calc.exe. Moreover, you can also access the binary via the UNC path to avoide the “C:\” pattern: \\127.0.0.1\C$\windows\system32\calc.exe

Similiar tricks can often be used to defeat blacklist approaches (e.g. if powershell.exe is forbidden, an attacker can call power^shell.exe to bypass the restriction. Or if calc is forbidden, you can execute:

^”%Localappdata:~-3%^%SystemRoot:~0,1%^”

to start calc.exe and so on).

REFERENCES:

https://msdn.microsoft.com/en-us/library/dn393272.aspx

https://tyranidslair.blogspot.co.at/2014/05/abusive-directory-syndrome.html

https://tyranidslair.blogspot.co.at/2014/06/addictive-double-quoting-sickness.html

https://googleprojectzero.blogspot.co.at/2016/02/the-definitive-guide-on-win32-to-nt.html

https://googleprojectzero.blogspot.co.at/2015/12/between-rock-and-hard-link.html

https://googleprojectzero.blogspot.co.at/2015/08/windows-10hh-symbolic-link-mitigations.html

http://insert-script.blogspot.co.at/2012/11/hidden-alternative-data-streams.html

https://bogner.sh/2017/11/avgater-getting-local-admin-by-abusing-the-anti-virus-quarantine/

Introducing QUIC support for HTTPS load balancing

$
0
0

If your service is sensitive to latency, QUIC will make it faster because of the way it establishes connections. When a web client uses TCP and TLS, it requires two to three round trips with a server to establish a secure connection before the browser can send a request. With QUIC, if a client has talked to a given server before, it can start sending data without any round trips, so your web pages will load faster. How much faster? On a well-optimized site like Google Search, connections are often pre-established, so QUIC’s faster connections can only speed up some requests—but QUIC still improves mean page load time by 8% globally, and up to 13% in regions where latency is higher.

Cedexis benchmarked our Cloud CDN performance using a Google Cloud project. Here’s what happened when we enabled QUIC.

Encryption is built into QUIC, using AEAD algorithms such as AES-GCM and ChaCha20 for both privacy and integrity. QUIC authenticates the parts of its headers that it doesn’t encrypt, so attackers can’t modify any part of a message.

Like HTTP/2, QUIC multiplexes multiple streams into one connection, so that a connection can serve several HTTP requests simultaneously. But HTTP/2 uses TCP as its transport, so all of its streams can be blocked when a single TCP packet is lost—a problem called head-of-line blocking. QUIC is different: Loss of a UDP packet within a QUIC connection only affects the streams contained within that packet. In other words, QUIC won’t let a problem with one request slow the others down, even on an unreliable connection.

Enabling QUIC

You can enable QUIC in your load balancer with a single setting in the GCP Console. Just edit the frontend configuration for your load balancer and enable QUIC negotiation for the IP and port you want to use, and you’re done.
You can also enable QUIC using gcloud:
gcloud compute target-https-proxies update proxy-name 
--quic_override=ENABLE
Once you’ve enabled QUIC, your load balancer negotiates QUIC with clients that support it, like Google Chrome and Chromium. Clients that do not support QUIC continue to use HTTPS seamlessly. If you distribute your own mobile client, you can integrate Cronet to gain QUIC support. The load balancer translates QUIC to HTTP/1.1 for your backend servers, just like traffic with any other protocol, so you don’t need to make any changes to your backends—all you need to do is enable QUIC in your load balancer.

The Future of QUIC

We’re working to help QUIC become a standard for web communication, just as we did with HTTP/2. The IETF formed a QUIC working group in November 2016, which has seen intense engagement from IETF participants, and is scheduled to complete v1 drafts this November. QUIC v1 will support HTTP over QUIC, use TLS 1.3 as the cryptographic handshake, and support migration of client connections. At the working group’s most recent interop event, participants presented over ten independent implementations.

QUIC is designed to evolve over time. A client and server can negotiate which version of QUIC to use, and as the IETF QUIC specifications become more stable and members reach clear consensus on key decisions, we’ve used that version negotiation to keep pace with the current IETF drafts. Future planned versions will also include features such as partial reliability, multipath, and support for non-HTTP applications like WebRTC.

QUIC works across changing network connections. QUIC can migrate client connections between cellular and Wifi networks, so requests don’t time out and fail when the current network degrades. This migration reduces the number of failed requests and decreases tail latency, and our developers are working on making it even better. QUIC client connection migration will soon be available in Cronet.

Try it out today

Read more about QUIC in the HTTPS load balancing documentation and enable it for your project(s) by editing your HTTP(S) load balancer settings. We look forward to your feedback!

Don’t Let Facebook, or Any Tracker, Follow You on the Web

$
0
0

Photo by Thought Catalog on Unsplash

In the early age of the internet, people enjoyed a high level of privacy. Webpages were just hypertext documents; almost no personalization of the user experience was offered (or ). The web today has evolved into a system of surveillance capitalism, where advertising networks follow users while they browse the web, continuously collecting traces of personal data and surfing patterns to create profiles of users in order to target them.

Using the web today, you are a target. And because of the rampant tracking across websites, each time you use the internet, you become an easier target. 

By tracking you across different applications and sites through cookies or open web sessions, your personal preferences and social connections are collected and often sold. Even if you do not accept cookies or are not logged into a service account, such as your Google, Twitter, or Facebook accounts, the web page and third-party services can still try to profile you by using third-party HTTP requests or other techniques. 

Within the HTTP request, various selectors can be included to communicate user preferences or particular features, in the form of URL variables. Personalized language or fonts settings, browser extensions, in-page keywords, battery charge and status, and more can be used to identify you by restricting the pool of possible candidates among all the visitors in a certain time frame, location, profile of interests. You can then be distinguished, or fingerprinted, across multiple devices or sessions and then the profile the tracker has on you is expanded.

By the sites and applications themselves, the story is spun to sound as if they’re doing you a favor: they say this collection allows them to customize your experience. You see ads more relevant to you, Facebook and others say. 

Even if you think of an advertising network as a recommendation system, this same system is also influencing what you see. It’s changing your experience of the internet. 

But at what cost is this customization? When confronted with transparency around what this “customization” takes, it poisons” the ad. So of course these companies are pushing back against transparency, but we need to keep pushing them and doing what we can to prevent them from continuing to exploit us online. 

You can be tracked while you’re logged in, while you’re not logged in, and even when you don’t have an account.

Part of the way they do this is through data they access from the Facebook apps on mobile, through your social connections on Facebook, and through the Facebook web components that can be used by websites and web applications. Every time you visit your local newspaper, if they are using Facebook comments or "like" buttons, these elements communicate some information to Facebook about who is surfing that page. 

Facebook collects information on social relationships, data representing users interactions, mobile devices, applications and games, and third-party applications accessed by you or your contacts through the online social network. Facebook was even found to have allowed companies access to the data of users’ friends without consent, even those friends who denied Facebook permission to share info with any third parties.
We have seen how companies aren't merely collecting user information to suggest shiny new products to buy. These profiles were collected by Facebook and shared to third parties, and instead of being used to suggest new products, companies like Cambridge Analytica were exploiting their knowledge ofyour political ideas and fears to convince you or your friends to vote for the side that was paying them more. 

How will this data be used in the future? What other ways has it already been used that we’re not aware of? What can we do about it?

To protect ourselves, we can try to limit what they collect about us online. 

How Tor Browser can help

While using Tor Browser won't prevent Facebook from acquiring your contact information if one of your friends uses the Facebook app on their mobile, it can certainly help to stop building up a profile so that third party trackers won't know if you prefer the Washington Post or Teen Vogue, or if you're already planning your next vacation.

Not only does Tor route your traffic through three layers of encryption, it also defends against most of the ways you can be identified online. 

Tor Browser was created to allow users to surf the web enjoying the privacy and security features offered by the Tor network, providing what is essentially a real "Private Browsing Mode" by default that defends against both network and local forensic adversaries. Tor Browser has enumerated and isolated a set of properties to prevent tracking networks like Facebook from exploiting stored data to identify users and a set offingerprinting defenses to prevent device and user identification. 

If you have multiple websites open in separate Tor Browser tabs, those websites, or their associated trackers, won’t have access to what you’re up to in other tabs. And any isolated cookies left by any site are cleared after each session.

If you still use Facebook 

We understand that for some, Facebook is still a vital part of their online lives, and deleting it isn’t realistic right now. For an added degree of protection, you can visit Facebook on the “dark web” at their .onion site using Tor Browser: https://www.facebookcorewwwi.onion/
Your session on the Facebook onion will be protected through end-to-end encryption, and it will protect you from Facebook learning your location. And just like when you are using Tor Browser, anyone monitoring your connection, like your ISP, will only see you're using Tor and not what you're up to
If you've never tried it before, it's too late to start protecting your privacy from online advertisers, social networks, and anyone else who wants to profit from your personal data by surfing the web with Tor Browser

The End of Video Coding?

$
0
0

In the IEEE Signal Processing Magazine issue November 2006 article “Future of Video Coding and Transmission” Prof. Edward Delp started by asking the panelists “Is video coding dead? Some feel that, with the higher coding efficiency of the H.264/MPEG-4 . . . perhaps there is not much more to do. I must admit that I have heard this compression is dead argument at least four times since I started working in image and video coding in 1976.

People were postulating that video coding was dead more than four decades ago. And yet here we are in 2018, organizing the 33rd edition of Picture Coding Symposium (PCS).

Is image and video coding dead? From the standpoint of application and relevance, video compression is very much alive and kicking and thriving on the internet. The Cisco white paper “The Zettabyte Era: Trends and Analysis (June 2017)” reported that in 2016, IP video traffic accounted for 73% of total IP traffic. This is estimated to go up to 82% by 2021. Sandvine reported in the “Global Internet Phenomena Report, June 2016” that 60% of peak download traffic on fixed access networks in North America was accounted for by four VOD services: Netflix, YouTube, Amazon Video and Hulu. Ericsson’s “Mobility Report November 2017” estimated that for mobile data traffic in 2017, video applications occupied 55% of the traffic. This is expected to increase to 75% by 2023.

As for industry involvement in video coding research, it appears that the area is more active than ever before. The Alliance for Open Media (AOM) was founded in 2015 by leading tech companies to collaborate on an open and royalty-free video codec. The goal of AOM was to develop video coding technology that was efficient, cost-effective, high quality and interoperable, leading to the launch of AV1 this year. In the ITU-T VCEG and ISO/IEC MPEG standardization world, the Joint Video Experts Team (JVET) was formed in October 2017 to develop a new video standard that has capabilities beyond HEVC. The recently-concluded Call for Proposals attracted an impressive number of 32 institutions from industry and academia, with a combined 22 submissions. The new standard, which will be called Versatile Video Coding (VVC), is expected to be finalized by October 2020.

Like many global internet companies, Netflix realizes that advancements in video coding technology are crucial for delivering more engaging video experiences. On one end, many people are constrained by unreliable networks or limited data plans, restricting the video quality that can be delivered with current technology. On the other side of the spectrum, premium video experiences like 4K UHD, 360-degree video and VR, are extremely data-heavy. Video compression gains are necessary to fuel the adoption of these immersive video technologies.

So how will we get to deliver HD quality Stranger Things at 100 kbps for the mobile user in rural Philippines? How will we stream a perfectly crisp 4K-HDR-WCG episode of Chef’s Table without requiring a 25 Mbps broadband connection? Radically new ideas. Collaboration. And forums like the Picture Coding Symposium 2018 where the video coding community can share, learn and introspect.

Influenced by our product roles at Netflix, exposure to the standardization community and industry partnerships, and research collaboration with academic institutions, we share some of our questions and thoughts on the current state of video coding research. These ideas have inspired us as we embarked on organizing the special sessions, keynote speeches and invited talks for PCS 2018.

Python's GIL implemented in pure Python

$
0
0

There is an excellent presentation of how the modern GIL performs thread scheduling, but unfortunately, it lacks some interesting details (at least for me). I was trying to understand all the details of the GIL, and it took me some time to fully understand it from the CPython's source code.

So here is a simplified algorithm of the thread scheduling that is taken from CPython 3.7 and rewritten from C to pure Python for those, who are trying to understand all the details.

importthreadingfromtypesimportSimpleNamespaceDEFAULT_INTERVAL=0.05gil_mutex=threading.RLock()gil_condition=threading.Condition(lock=gil_mutex)switch_condition=threading.Condition()# dictionary-like object that supports dot (attribute) syntaxgil=SimpleNamespace(drop_request=False,locked=True,switch_number=0,last_holder=None,eval_breaker=True)defdrop_gil(thread_id):ifnotgil.locked:raiseException("GIL is not locked")gil_mutex.acquire()gil.last_holder=thread_idgil.locked=False# Signals that the GIL is now available for acquiring to the first awaiting threadgil_condition.notify()gil_mutex.release()# force switching# Lock current thread so it will not immediately reacquire the GIL# this ensures that another GIL-awaiting thread have a chance to get scheduledifgil.drop_request:switch_condition.acquire()ifgil.last_holder==thread_id:gil.drop_request=Falseswitch_condition.wait()switch_condition.release()deftake_gil(thread_id):gil_mutex.acquire()whilegil.locked:saved_switchnum=gil.switch_number# Release the lock and wait for a signal from a GIL holding thread,# set drop_request=True if the wait is timed outtimed_out=notgil_condition.wait(timeout=DEFAULT_INTERVAL)iftimed_outandgil.lockedandgil.switch_number==saved_switchnum:gil.drop_request=True# lock for force switchingswitch_condition.acquire()# Now we hold the GILgil.locked=Trueifgil.last_holder!=thread_id:gil.last_holder=thread_idgil.switch_number+=1# force switching, send signal to drop_gilswitch_condition.notify()switch_condition.release()ifgil.drop_request:gil.drop_request=Falsegil_mutex.release()defexecution_loop(target_function,thread_id):# Compile Python function down to bytecode and execute it in the while loopbytecode=compile(target_function)whileTrue:# drop_request indicates that one or more threads are awaiting for the GILifgil.drop_request:# release the gil from the current threaddrop_gil(thread_id)# immediately request the GIL for the current thread# at this point the thread will be waiting for GIL and suspended until the function returntake_gil(thread_id)# bytecode execution logic, executes one instruction at a timeinstruction=bytecode.next_instruction()ifinstructionisnotNone:execute_opcode(instruction)else:return

Note that this code will not run if you will try to execute it, because it's missing bytecode execution logic.

Some things to note

  • Each thread executes its code in the separate execution_loop which is run by the real OS threads.
  • When Python creates a thread it calls the take_gil function before entering the execution_loop.
  • Basically, the job of the GIL is to pause the while loop for all threads except for a thread that currently owns the GIL. For example, if you have three threads, two of them will be suspended. Typically but not necessarily, only one Python thread can execute Python opcodes at a time, and the rest will be waiting a split second of time until the GIL will be switched to them.
  • The C implementation can be found here and here.

A comment from the source code describes the algorithm as follows:

/*   Notes about the implementation:   - The GIL is just a boolean variable (locked) whose access is protected     by a mutex (gil_mutex), and whose changes are signalled by a condition     variable (gil_cond). gil_mutex is taken for short periods of time,     and therefore mostly uncontended.   - In the GIL-holding thread, the main loop (PyEval_EvalFrameEx) must be     able to release the GIL on demand by another thread. A volatile boolean     variable (gil_drop_request) is used for that purpose, which is checked     at every turn of the eval loop. That variable is set after a wait of     `interval` microseconds on `gil_cond` has timed out.      [Actually, another volatile boolean variable (eval_breaker) is used       which ORs several conditions into one. Volatile booleans are       sufficient as inter-thread signalling means since Python is run       on cache-coherent architectures only.]   - A thread wanting to take the GIL will first let pass a given amount of     time (`interval` microseconds) before setting gil_drop_request. This     encourages a defined switching period, but doesn't enforce it since     opcodes can take an arbitrary time to execute.     The `interval` value is available for the user to read and modify     using the Python API `sys.{get,set}switchinterval()`.   - When a thread releases the GIL and gil_drop_request is set, that thread     ensures that another GIL-awaiting thread gets scheduled.     It does so by waiting on a condition variable (switch_cond) until     the value of last_holder is changed to something else than its     own thread state pointer, indicating that another thread was able to     take the GIL.     This is meant to prohibit the latency-adverse behaviour on multi-core     machines where one thread would speculatively release the GIL, but still     run and end up being the first to re-acquire it, making the "timeslices"     much longer than expected.     (Note: this mechanism is enabled with FORCE_SWITCHING above)*/

Popular posts in Python category

The Strange, Fading Call of the Narwhal

$
0
0

Among the many splendid creatures certain to be affected by a warming climate is the narwhal, the unicorn of the sea. The narwhal, a pale, porpoise-like resident of Arctic waters, and a close relative of the beluga whale, takes its name from the Old Norse word nahvalr, or “corpse-whale,” for its resemblance to the bodies of dead sailors. It is best known for the long horn—in fact a tooth, one of just two in the animal’s head—that extends through its upper lip. Last year, scientists discovered that narwhals use the tusk, a sensory tool loaded with nerve endings, to whack and stun fish before eating them.

But little is known about the narwhal’s day-to-day life. Narwhals are skittish in the wild and don’t thrive in captivity. Like other cetaceans, they rely on an array of vocalizations to locate prey, communicate, and navigate in the dark sea, especially during the months with little or no daylight. But the audio recordings that scientists have gathered in the past have offered limited information; they were collected either by stationary underwater microphones, which can only hear whatever happens to swim by, or by mikes that are attached to an individual animal and fall off after a couple of hours.

A new paper this week in the open-access journal PLOS ONE offers a far richer narrative. The scientists, led by Susanna Blackwell of Greeneridge Sciences, an acoustics-research firm, managed to tag six narwhals—five females and one male—with mikes that remained on the animals for nearly a week. From each narwhal, they gathered several continuous days of audio, more than five hundred hours altogether. The animals were also fitted with G.P.S. trackers, so their vocalizations, which were virtually non-stop, could be precisely collated with their location and depth. The net result was an intimate sonic document of the life of the narwhal. The recordings were also the first of narwhals in the waters of East Greenland, a population that has been separated from (previously recorded) others for ten thousand years and may be genetically distinct.

The researchers identified three types of sounds. The first two, clicking and buzzing, are used to navigate and to hone in on prey; it’s a form of echolocation, much like what bats use to fly and to catch insects in the dark. These vocalizations tend to be made deep in the water column, between seven hundred feet and two thousand feet down, where their prey—cod and shrimp—tend to congregate. One recording, of a female named Eistla echolocating while on a foraging dive, recalls the tapping of a woodpecker. In another, of a female named Freya, the sound of water running from a melting glacier can be heard in the background.

The third kind of sound—calling—is probably how narwhals speak to one another, and involves an entertaining array of whistles, clicks, and sonic pulses. The researchers caught a female named Frida calling on what sounds like a toy trumpet. Sometimes a narwhal’s mike picked up the sound of several of its colleagues calling at once, in what the authors refer to as a “conference.” These vocalizations were typically made closer to the surface, half of them from no more than twenty feet down.

Tracking when and where narwhals make such sounds will help researchers understand how the animals’ behavior is altered by climate change and the growing presence of humans in the Arctic. For the moment, the opportunities for recording the sounds of narwhals are rich. Ship traffic hasn’t yet flooded the Arctic with underwater noise, and undersea drilling and blasting is still rare there; both can mask the sounds of narwhals and other cetaceans and scare off the animals altogether. But, as everywhere, the chance to listen without hearing ourselves in the background is melting away.

Show HN: World Cup 2018 Predictions with Bayesian ML

$
0
0

Evidence for biological shaping of hair ice (2015) [pdf]

Microsoft Office rewrite to React.js nears completion

$
0
0

The whole of Microsoft Office 365 software suite is being rewritten in React.js. This was revealed on Twitter in a thread bashing scripting languages for being unsuitable for creating complex applications.

Even earlier Microsoft has embraced the five-year-old JavaScript UI library by building it's popular Outlook Webmail access using the technology in 2017. This free service has hardly been a core business, but the company is now expanding to use the UI library in it's crown jewel, Microsoft Office.

According to Sean Thomas Larkin, of Webpack fame, the whole of the Microsoft Office product spectrum will embrace React.js in a big way. Not only will the company improve it's online version to better compete with Google office suite, it is going all in on React.

The company will use a shared codebase that will be derived to Web, Mobile and Desktop applications (for macOS and Windows). Each version will use an optimal technology selection for the underlying operating environment. The web version will use standard React as a SPA application.

Mobile versions for Android, iPad and iPhone devices will use React Native to build native applications for the device. Microsoft's own UWP platform is a target for contemporary Windows devices, and a version for WIN32 APIs is built using the Electron framework.

The exact results for this massive project are yet to be revealed, but given the quality of the Outlook React.js rewrite - it would seem like the company is set to unleash some impressive software on multiple platforms. The company is also able to leverage it's internal JavaScript engine Chakra and it's Edge browser well beyond Windows.

Source: Twitter


Written by Jorgé on Thursday June 14, 2018

Permalink -

« Polymer 3.0 released at I/O, accelerates PWA development

In MySQL, don’t use “utf8”, use “utf8mb4”

$
0
0

Today’s bug: I tried to store a UTF-8 string in a MariaDB “utf8”-encoded database, and Rails raised a bizarre error:

Incorrect string value: ‘\xF0\x9F\x98\x83 <…’ for column ‘summary’ at row 1

This is a UTF-8 client and a UTF-8 server, in a UTF-8 database with a UTF-8 collation. The string, “😃<…”, is valid UTF-8.

But here’s the rub: MySQL’s “utf8isn’t UTF-8.

The “utf8” encoding only supports three bytes per character. The real UTF-8 encoding — which everybody uses, including you — needs up to four bytes per character.

MySQL developers never fixed this bug. They released a workaround in 2010: a new character set called “utf8mb4”.

Of course, they never advertised this (probably because the bug is so embarrassing). Now, guides across the Web suggest that users use “utf8”. All those guides are wrong.

In short:

  • MySQL’s “utf8mb4” means “UTF-8”.
  • MySQL’s “utf8” means “a proprietary character encoding”. This encoding can’t encode many Unicode characters.

I’ll make a sweeping statement here: all MySQL and MariaDB users who are currently using “utf8” should actually use “utf8mb4”. Nobody should ever use “utf8”.

What’s encoding? What’s UTF-8?

Joel on Software wrote my favorite introduction. I’ll abridge it.

Computers store text as ones and zeroes. The first letter in this paragraph was stored as “01000011” and your computer drew “C”. Your computer chose “C” in two steps:

  1. Your computer read “01000011” and determined that it’s the number 67. That’s because 67 was encoded as “01000011”.
  2. Your computer looked up character number 67 in the Unicodecharacter set, and it found that 67 means “C”.

The same thing happened on my end when I typed that “C”:

  1. My computer mapped “C” to 67 in the Unicode character set.
  2. My computer encoded 67, sending “01000011” to this web server.

Character sets are a solved problem. Almost every program on the Internet uses the Unicode character set, because there’s no incentive to use another.

But encoding is more of a judgement call. Unicode has slots for over a million characters. (“C” and “💩” are two such characters.) The simplest encoding, UTF-32, makes each character take 32 bits. That’s simple, because computers have been treating groups of 32 bits as numbers for ages, and they’re really good at it. But it’s not useful: it’s a waste of space.

UTF-8 saves space. In UTF-8, common characters like “C” take 8 bits, while rare characters like “💩” take 32 bits. Other characters take 16 or 24 bits. A blog post like this one takes about four times less space in UTF-8 than it would in UTF-32. So it loads four times faster.

You may not realize it, but our computers agreed on UTF-8 behind the scenes. If they didn’t, then when I type “💩” you’ll see a mess of random data.

MySQL’s “utf8” character set doesn’t agree with other programs. When they say “💩”, it balks.

A bit of MySQL history

Why did MySQL developers make “utf8” invalid? We can guess by looking at commit logs.

MySQL supported UTF-8 since version 4.1. That was 2003 — before today’s UTF-8 standard, RFC 3629.

The previous UTF-8 standard, RFC 2279, supported up to six bytes per character. MySQL developers coded RFC 2279 in the the first pre-pre-release version of MySQL 4.1 on March 28, 2002.

Then came a cryptic, one-byte tweak to MySQL’s source code in September: “UTF8 now works with up to 3 byte sequences only.”

Who committed this? Why? I can’t tell. MySQL’s code repository seems to have lost old author names when it adopted Git. (MySQL used to use BitKeeper, like the Linux kernel.) There’s nothing on the mailing list around September 2003 that explains the change.

But I can guess.

Back in 2002, MySQL gave users a speed boost if users could guarantee that every row in a table had the same number of bytes. To do that, users would declare text columns as “CHAR”. A “CHAR” column always has the same number of characters. If you feed it too few characters, it adds spaces to the end; if you feed it too many characters, it truncates the last ones.

When MySQL developers first tried UTF-8, with its back-in-the-day six bytes per character, they likely balked: a CHAR(1) column would take six bytes; a CHAR(2) column would take 12 bytes; and so on.

Let’s be clear: that initial behavior, which was never released, was correct. It was well documented and widely adopted, and anybody who understood UTF-8 would agree that it was right.

But clearly, a MySQL developer (or businessperson) was concerned that a user or two would do two things:

  1. Choose CHAR columns. (The CHAR format is a relic nowadays. Back then, MySQL was faster with CHAR columns. Ever since 2005, it’s not.)
  2. Choose to encode those CHAR columns as “utf8”.

My guess is that MySQL developers broke their “utf8” encoding to help these users: users who both 1) tried to optimize for space and speed; and 2) failed to optimize for speed and space.

Nobody won. Users who wanted speed and space were still wrong to use “utf8” CHAR columns, because those columns were still bigger and slower than they had to be. And developers who wanted correctness were wrong to use “utf8”, because it can’t store “💩”.

Once MySQL published this invalid character set, it could never fix it: that would force every user to rebuild every database. MySQL finally released UTF-8 support in 2010, with a different name: “utf8mb4”.

Why it’s so frustrating

Clearly I was frustrated this week. My bug was hard to find because I was fooled by the name “utf8”. And I’m not the only one — almost every article I found online touted “utf8” as, well, UTF-8.

The name “utf8” was always an error. It’s a proprietary character set. It created new problems, and it didn’t solve the problem it meant to solve.

It’s false advertising.

My take-away lessons

  1. Database systems have subtle bugs and oddities, and you can avoid a lot of bugs by avoiding database systems.
  2. If you need a database, don’t use MySQL or MariaDB. Use PostgreSQL.
  3. If you need to use MySQL or MariaDB, never use “utf8”. Always use “utf8mb4” when you want UTF-8. Convert your database now to avoid headaches later.

‍ What, Why and How of PHP Composer ️

$
0
0

What, why and how of PHP Composer

Let's demystify the package manager Laravel and other frameworks use

Since developers have realised the power and benefits of the DRY approach, lots of frameworks and libraries have been crafted privately and open-source.

If you're someone like me (myself 2 years ago to be precise), you might say - "Why all these new frameworks are not allowing a direct .zip download? Why do I have to install (and learn) this new Composer thing just to download a framework?"

Back in the days when I was using Codeigniter and CakePHP 2, I would just download .zip file, extract it in my project directory and start developing. So neat, right? Read on.

Then, I witnessed new version CakePHP 3 in 2015 (so unlucky I didn't try Laravel that time). It was forcing me to use composer to download the framework and I was very new to it. I was complaining, like others, until I realised how much time and headaches it is going to save for me.

What it Composer?

Composer is a dependency manager and autoloading expert for PHP.

Have you heard about or used npm? (or yarn) Or if you're a Rubyist, Bundler must not be new to you. Composer provides similar functionality for the PHP world. It used to be PEAR (PHP Extension and Application Repository) in early days.

One important thing to note here is that the open-source packages generally recide on Packagist and composer downloads the dependencies from there, unless you specify other location. Packagist, in turn, keep and updates the code from Git/Svn repositories. And you can also use private repository with composer by using Private packagist or hosting them yourself.

I hate theory. Let's have some practical talk.

Pains that Composer fixes

Following are some of pains that Composer has relieved:

Dependency Management

Dependency Management

When you are working on a new project using a framework, you depend on it's updates. As they release new versions with bug fixes and new features, you should keep the framework updated for security, performance, and other reasons.

But, it's a pain to manually download it everytime, replace the existing files and test things again. It takes time. And that is why there are so many old codebases relying on the versions of frameworks that are no longer supported. Working on legacy projects is something that all of us try to avoid, isn't it?

Project directory size

Project directory size

Pre-composer days, the size of the project directory used to be very big. We would carry all the libraries that our project depends on and pass around the project either in USB sticks or pollute the VCS (git) history.

Enter Composer - Size reduces to less than 20%? We can get away without keeping the dependencies in the project (.gitignore) and avoid version mismatches at the same time thanks to composer.lock file.

sad fact - Codeigniter 3 still uses the traditional download system.

Hours of debugging

The libraries or frameworks that your project uses depend on some other libraries (and the chain continues...). Possibly, the framework is using version X of a library while another library is using version Y of the same library.

You have been getting errors due to some clash or incompatibilty and have to put a lot of time to get to the base of the issue. No more - composer keeps only one copy of a library with a suitable version or denies the installation request.

Autoloading

Remember that long list require statements? As the project grows in size, so does the number of files we need to include in each of the file. PHP autoloading came to the rescue but still it was comparatively hard to setup and maintain as dependencies grow. Less discussed powerful feature of Composer is Autoloading. It supports PSR-0, PSR-4, class mapping as well as files autoloading. We need to require just one file and we're done. Play with straightforward namespaces and enjoy the development time.

Less known fact - Composer provides three different levels of autoloader optimisation for your different level of needs.

Lengthy Installation procedures

Lengthy Installation procedures

Often times, one or more steps need to be followed after downloading a library for setup and installation. Package maintainers had to write detailed installation procedures in the documentation and still answer support queries when users won't follow them and then complain about errors. Composer scripts are a boon for them.

One can easily code the steps that can be automated and run as a script during various stages of the package download. For example, Laravel uses composer scripts to create an .env file, create an application key, and perform automatic discovery of the packages.

Platform Requirements

The code of your library/package may support only latest PHP versions or depend on specific PHP extensions. And you can inform Composer about this resulting in prevention of package downloads on the systems that don't meet the requirements. For example,

"require": {
    "php": "^7.1.3",
    "ext-mbstring": "*",
    "ext-openssl": "*",
    ...
},

Add this to your composer.json and composer will throw an error when the systems with PHP less than v7.1.3 or without mbstring and openssl extension try to download the package.

Maintaining a library/package

Maintaining a library package

Package maintainers had to either maintain different directories for each version of the package or release new versions through GitHub everytime there was an important update. Thanks to the graceful integration of Composer with VCS tags and branches, one just needs to add a tag to the commit and push. The rest is taken care of.

Composer highly recommends Semantic Versioning and following that, package maintainers can keep focus on actual development without worrying about the distribution.

Marvellous. I do not have complains any more and am ready to jump in. What next?

Nuts and bolts of Composer

Now that we have an idea about what and why of the Composer. Let's jump into the how part:

Installation

The installation instructions on the composer documentation are pretty clear and I think my best job is to link you there.

Consumption

If you want to build a project using Laravel, you need to install it using composer. Though some people want to go with the traditional way, it is highly discouraged.

Laravel itself uses lots of useful open-source package like PHPUnit, Monolog, Carbon, etc. Those dependencies are also managed by composer. You should learn about version management to avoid potential issues.

Fun Fact - Composer installs dependencies in the vendor directory by default but it also supports custom installers for various package types that can install dependecicies in other directories.

Version management

Understanding how composer downloads the libraries based on the version constraints specified in your composer.json file will help you a long way. I recommend you to go through the original documentation article at least once.

Did you know? - You can require a package by its version, branch or even by a specific commit SHA (not recommended).

Personally, my suggestion is to use Caret Version Range (^) for the packages which use Semantic versioning and Wildcard Version Range (.*) for others as they are easy to grasp.

Understanding composer.lock file

While composer.json is managed automatically when you use the create-project command or when you directly require a package from the terminal. composer.lock is something you should be aware of.

First of all, you should commit your composer.lock file to make sure that everyone of your team members use the same copy of the dependencies while working on a common project. How does that happen?

Whenever you run composer install, Composer actually checks for the existence of the composer.lock file. If it is present, it installs all the dependencies as per the lock file which contains exact version numbers and SHAs to be used. If lock file is not present, Composer simply reads the composer.json file, installs the dependencies and creates the composer.lock file. Next time you run the install command on server or some other computer, lock file is used to give you the exact same copy.

On the other hand, composer update command looks at the composer.json file directly, installs the new versions of the dependencies, if available, as per the version contstraints and updates the lock file.

Slowness of Composer

Slowness of Composer

I have experienced slow installs and updates by composer. Unknown about what's going on in the background, I would just keep staring at the screen as I wait for it to complete before I can take my next step.

If you're facing the same issue, I suggest you to append the composer command with --profile and -vv or even -vvv to have more information about background processing. For example,

composer install -vv --profile

If you cannot find any specific issue from the output, you can also try this package to enable parallel downloads.

Package development

If are just starting out building your first package/library, there is a very useful tip to make the development easy and comfortable.

Most of the times, the package/library needs to be tested against an actual project during development and for that - maintainer may need to keep the package inside the actual project to avoid unnecessary multiple releases until he's done.

Composer Path repositories can save yourself from that trap. It will Symlink or Mirror the repo in the project and you can keep the code bases separate and manage and switch them easily.

Laravel super artisan Caleb Porzio even added a bash alias to use this feature with a single command.

Quick tip - If your package contains a command line script which you would like to pass along to the users, consider using vendor binaries. PHPUnit uses it to quickly let you fire vendor/bin/phpunit.

Branch Aliasis

Once your package/library is already being used by multiple projects, you should also consider adding branch aliasis to make developers' life a bit easier. This article explains the reason behind it very well and also specifies how to do it.

Advanced level developers - Composer allows you to alter or expand it's functionality by using composer-plugins. You can perform actions when your package is loaded and when certain events are fired.

Final notes

This was a bit longer one. We covered quick history about dependency management, learned what Composer is, discussed about the pains that it fixes and then went through some useful points and tips around composer for the new developers and package maintainers.

That is pretty much what I had to say. If you've reached here all the way from the top reading each line, thank you. I think our thinking style matches. Say hi in the comment section below.

If you have any questions, feel free to post your comment, I would try my best to solve your queries.

And If you think this can help other developers in your online network, I’d be happy to see you sharing this with them. Thanks.

A Gentle Introduction to Algorithm Complexity Analysis

$
0
0
Dionysis "dionyziz" Zindros dionyziz@gmail.com>

Introduction

A lot of programmers that make some of the coolest and most useful software today, such as many of the stuff we see on the Internet or use daily, don't have a theoretical computer science background. They're still pretty awesome and creative programmers and we thank them for what they build.

However, theoretical computer science has its uses and applications and can turn out to be quite practical. In this article, targeted at programmers who know their art but who don't have any theoretical computer science background, I will present one of the most pragmatic tools of computer science: Big O notation and algorithm complexity analysis. As someone who has worked both in a computer science academic setting and in building production-level software in the industry, this is the tool I have found to be one of the truly useful ones in practice, so I hope after reading this article you can apply it in your own code to make it better. After reading this post, you should be able to understand all the common terms computer scientists use such as "big O", "asymptotic behavior" and "worst-case analysis".

This text is also targeted at the junior high school and high school students from Greece or anywhere else internationally competing in the International Olympiad in Informatics, an algorithms competition for students, or other similar competitions. As such, it does not have any mathematical prerequisites and will give you the background you need in order to continue studying algorithms with a firmer understanding of the theory behind them. As someone who used to compete in these student competitions, I highly advise you to read through this whole introductory material and try to fully understand it, because it will be necessary as you study algorithms and learn more advanced techniques.

I believe this text will be helpful for industry programmers who don't have too much experience with theoretical computer science (it is a fact that some of the most inspiring software engineers never went to college). But because it's also for students, it may at times sound a little bit like a textbook. In addition, some of the topics in this text may seem too obvious to you; for example, you may have seen them during your high school years. If you feel you understand them, you can skip them. Other sections go into a bit more depth and become slightly theoretical, as the students competing in this competition need to know more about theoretical algorithms than the average practitioner. But these things are still good to know and not tremendously hard to follow, so it's likely well worth your time. As the original text was targeted at high school students, no mathematical background is required, so anyone with some programming experience (i.e. if you know what recursion is) will be able to follow through without any problem.

Throughout this article, you will find various pointers that link you to interesting material often outside the scope of the topic under discussion. If you're an industry programmer, it's likely that you're familiar with most of these concepts. If you're a junior student participating in competitions, following those links will give you clues about other areas of computer science or software engineering that you may not have yet explored which you can look at to broaden your interests.

Big O notation and algorithm complexity analysis is something a lot of industry programmers and junior students alike find hard to understand, fear, or avoid altogether as useless. But it's not as hard or as theoretical as it may seem at first. Algorithm complexity is just a way to formally measure how fast a program or algorithm runs, so it really is quite pragmatic. Let's start by motivating the topic a little bit.

Motivation

We already know there are tools to measure how fast a program runs. There are programs called profilers which measure running time in milliseconds and can help us optimize our code by spotting bottlenecks. While this is a useful tool, it isn't really relevant to algorithm complexity. Algorithm complexity is something designed to compare two algorithms at the idea level — ignoring low-level details such as the implementation programming language, the hardware the algorithm runs on, or the instruction set of the given CPU. We want to compare algorithms in terms of just what they are: Ideas of how something is computed. Counting milliseconds won't help us in that. It's quite possible that a bad algorithm written in a low-level programming language such as assembly runs much quicker than a good algorithm written in a high-level programming language such as Python or Ruby. So it's time to define what a "better algorithm" really is.

As algorithms are programs that perform just a computation, and not other things computers often do such as networking tasks or user input and output, complexity analysis allows us to measure how fast a program is when it performs computations. Examples of operations that are purely computational include numerical floating-point operations such as addition and multiplication; searching within a database that fits in RAM for a given value; determining the path an artificial-intelligence character will walk through in a video game so that they only have to walk a short distance within their virtual world (see Figure 1); or running a regular expression pattern match on a string. Clearly, computation is ubiquitous in computer programs.

Complexity analysis is also a tool that allows us to explain how an algorithm behaves as the input grows larger. If we feed it a different input, how will the algorithm behave? If our algorithm takes 1 second to run for an input of size 1000, how will it behave if I double the input size? Will it run just as fast, half as fast, or four times slower? In practical programming, this is important as it allows us to predict how our algorithm will behave when the input data becomes larger. For example, if we've made an algorithm for a web application that works well with 1000 users and measure its running time, using algorithm complexity analysis we can have a pretty good idea of what will happen once we get 2000 users instead. For algorithmic competitions, complexity analysis gives us insight about how long our code will run for the largest testcases that are used to test our program's correctness. So if we've measured our program's behavior for a small input, we can get a good idea of how it will behave for larger inputs. Let's start by a simple example: Finding the maximum element in an array.

Counting instructions

In this article, I'll use various programming languages for the examples. However, don't despair if you don't know a particular programming language. Since you know programming, you should be able to read the examples without any problem even if you aren't familiar with the programming language of choice, as they will be simple and I won't use any esoteric language features. If you're a student competing in algorithms competitions, you most likely work with C++, so you should have no problem following through. In that case I recommend working on the exercises using C++ for practice.

The maximum element in an array can be looked up using a simple piece of code such as this piece of Javascript code. Given an input array A of size n:

            var M = A[ 0 ];

            for ( var i = 0; i < n; ++i ) {
                if ( A[ i ] >= M ) {
                    M = A[ i ];
                }
            }

Now, the first thing we'll do is count how many fundamental instructions this piece of code executes. We will only do this once and it won't be necessary as we develop our theory, so bear with me for a few moments as we do this. As we analyze this piece of code, we want to break it up into simple instructions; things that can be executed by the CPU directly - or close to that. We'll assume our processor can execute the following operations as one instruction each:

  • Assigning a value to a variable
  • Looking up the value of a particular element in an array
  • Comparing two values
  • Incrementing a value
  • Basic arithmetic operations such as addition and multiplication

We'll assume branching (the choice between if and else parts of code after the if condition has been evaluated) occurs instantly and won't count these instructions. In the above code, the first line of code is:

            var M = A[ 0 ];

This requires 2 instructions: One for looking up A[ 0 ] and one for assigning the value to M (we're assuming that n is always at least 1). These two instructions are always required by the algorithm, regardless of the value of n. The for loop initialization code also has to always run. This gives us two more instructions; an assignment and a comparison:

            i = 0;
            i < n;

These will run before the first for loop iteration. After each for loop iteration, we need two more instructions to run, an increment of i and a comparison to check if we'll stay in the loop:

            ++i;
            i < n;

So, if we ignore the loop body, the number of instructions this algorithm needs is 4 + 2n. That is, 4 instructions at the beginning of the for loop and 2 instructions at the end of each iteration of which we have n. We can now define a mathematical function f( n ) that, given an n, gives us the number of instructions the algorithm needs. For an empty for body, we have f( n ) = 4 + 2n.

Worst-case analysis

Now, looking at the for body, we have an array lookup operation and a comparison that happen always:

            if ( A[ i ] >= M ) { ...

That's two instructions right there. But the if body may run or may not run, depending on what the array values actually are. If it happens to be so that A[ i ] >= M, then we'll run these two additional instructions — an array lookup and an assignment:

            M = A[ i ]

But now we can't define an f( n ) as easily, because our number of instructions doesn't depend solely on n but also on our input. For example, for A = [ 1, 2, 3, 4 ] the algorithm will need more instructions than for A = [ 4, 3, 2, 1 ]. When analyzing algorithms, we often consider the worst-case scenario. What's the worst that can happen for our algorithm? When does our algorithm need the most instructions to complete? In this case, it is when we have an array in increasing order such as A = [ 1, 2, 3, 4 ]. In that case, M needs to be replaced every single time and so that yields the most instructions. Computer scientists have a fancy name for that and they call it worst-case analysis; that's nothing more than just considering the case when we're the most unlucky. So, in the worst case, we have 4 instructions to run within the for body, so we have f( n ) = 4 + 2n + 4n = 6n + 4. This function f, given a problem size n, gives us the number of instructions that would be needed in the worst-case.

Asymptotic behavior

Given such a function, we have a pretty good idea of how fast an algorithm is. However, as I promised, we won't be needing to go through the tedious task of counting instructions in our program. Besides, the number of actual CPU instructions needed for each programming language statement depends on the compiler of our programming language and on the available CPU instruction set (i.e. whether it's an AMD or an Intel Pentium on your PC, or a MIPS processor on your Playstation 2) and we said we'd be ignoring that. We'll now run our "f" function through a "filter" which will help us get rid of those minor details that computer scientists prefer to ignore.

In our function, 6n + 4, we have two terms: 6n and 4. In complexity analysis we only care about what happens to the instruction-counting function as the program input (n) grows large. This really goes along with the previous ideas of "worst-case scenario" behavior: We're interested in how our algorithm behaves when treated badly; when it's challenged to do something hard. Notice that this is really useful when comparing algorithms. If an algorithm beats another algorithm for a large input, it's most probably true that the faster algorithm remains faster when given an easier, smaller input. From the terms that we are considering, we'll drop all the terms that grow slowly and only keep the ones that grow fast as n becomes larger. Clearly 4 remains a 4 as n grows larger, but 6n grows larger and larger, so it tends to matter more and more for larger problems. Therefore, the first thing we will do is drop the 4 and keep the function as f( n ) = 6n.

This makes sense if you think about it, as the 4 is simply an "initialization constant". Different programming languages may require a different time to set up. For example, Java needs some time to initialize its virtual machine. Since we're ignoring programming language differences, it only makes sense to ignore this value.

The second thing we'll ignore is the constant multiplier in front of n, and so our function will become f( n ) = n. As you can see this simplifies things quite a lot. Again, it makes some sense to drop this multiplicative constant if we think about how different programming languages compile. The "array lookup" statement in one language may compile to different instructions in different programming languages. For example, in C, doing A[ i ] does not include a check that i is within the declared array size, while in Pascal it does. So, the following Pascal code:

            M := A[ i ]

Is the equivalent of the following in C:

            if ( i >= 0 && i < n ) {
                M = A[ i ];
            }

So it's reasonable to expect that different programming languages will yield different factors when we count their instructions. In our example in which we are using a dumb compiler for Pascal that is oblivious of possible optimizations, Pascal requires 3 instructions for each array access instead of the 1 instruction C requires. Dropping this factor goes along the lines of ignoring the differences between particular programming languages and compilers and only analyzing the idea of the algorithm itself.

This filter of "dropping all factors" and of "keeping the largest growing term" as described above is what we call asymptotic behavior. So the asymptotic behavior of f( n ) = 2n + 8 is described by the function f( n ) = n. Mathematically speaking, what we're saying here is that we're interested in the limit of function f as n tends to infinity; but if you don't understand what that phrase formally means, don't worry, because this is all you need to know. (On a side note, in a strict mathematical setting, we would not be able to drop the constants in the limit; but for computer science purposes, we want to do that for the reasons described above.) Let's work a couple of examples to familiarize ourselves with the concept.

Let us find the asymptotic behavior of the following example functions by dropping the constant factors and by keeping the terms that grow the fastest.

  1. f( n ) = 5n + 12 gives f( n ) = n.

    By using the exact same reasoning as above.

  2. f( n ) = 109 gives f( n ) = 1.

    We're dropping the multiplier 109 * 1, but we still have to put a 1 here to indicate that this function has a non-zero value.

  3. f( n ) = n2 + 3n + 112 gives f( n ) = n2

    Here, n2 grows larger than 3n for sufficiently large n, so we're keeping that.

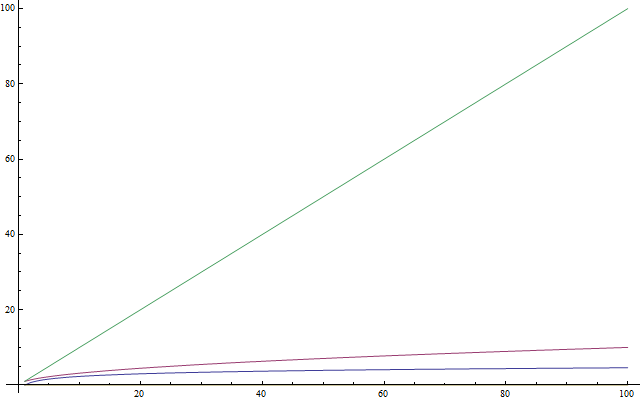
  4. f( n ) = n3 + 1999n + 1337 gives f( n ) = n3

    Even though the factor in front of n is quite large, we can still find a large enough n so that n3 is bigger than 1999n. As we're interested in the behavior for very large values of n, we only keep n3 (See Figure 2).

  5. f( n ) = n + sqrt( n ) gives f( n ) = n

    This is so because n grows faster than sqrt( n ) as we increase n.

You can try out the following examples on your own:

Exercise 1

  1. f( n ) = n6 + 3n
  2. f( n ) = 2n + 12
  3. f( n ) = 3n + 2n
  4. f( n ) = nn + n

(Write down your results; the solution is given below)

If you're having trouble with one of the above, plug in some large n and see which term is bigger. Pretty straightforward, huh?

Complexity

So what this is telling us is that since we can drop all these decorative constants, it's pretty easy to tell the asymptotic behavior of the instruction-counting function of a program. In fact, any program that doesn't have any loops will have f( n ) = 1, since the number of instructions it needs is just a constant (unless it uses recursion; see below). Any program with a single loop which goes from 1 to n will have f( n ) = n, since it will do a constant number of instructions before the loop, a constant number of instructions after the loop, and a constant number of instructions within the loop which all run n times.

This should now be much easier and less tedious than counting individual instructions, so let's take a look at a couple of examples to get familiar with this. The following PHP program checks to see if a particular value exists within an array A of size n:

<?php
                $exists = false;
                for ( $i = 0; $i < n; ++$i ) {
                    if ( $A[ $i ] == $value ) {
                        $exists = true;
                        break;
                    }
                }
            ?>

This method of searching for a value within an array is called linear search. This is a reasonable name, as this program has f( n ) = n (we'll define exactly what "linear" means in the next section). You may notice that there's a "break" statement here that may make the program terminate sooner, even after a single iteration. But recall that we're interested in the worst-case scenario, which for this program is for the array A to not contain the value. So we still have f( n ) = n.

Exercise 2

Systematically analyze the number of instructions the above PHP program needs with respect to n in the worst-case to find f( n ), similarly to how we analyzed our first Javascript program. Then verify that, asymptotically, we have f( n ) = n.

Let's look at a Python program which adds two array elements together to produce a sum which it stores in another variable:

            v = a[ 0 ] + a[ 1 ]

Here we have a constant number of instructions, so we have f( n ) = 1.

The following program in C++ checks to see if a vector (a fancy array) named A of size n contains the same two values anywhere within it:

            bool duplicate = false;
            for ( int i = 0; i < n; ++i ) {
                for ( int j = 0; j < n; ++j ) {
                    if ( i != j && A[ i ] == A[ j ] ) {
                        duplicate = true;
                        break;
                    }
                }
                if ( duplicate ) {
                    break;
                }
            }

As here we have two nested loops within each other, we'll have an asymptotic behavior described by f( n ) = n2.

Rule of thumb: Simple programs can be analyzed by counting the nested loops of the program. A single loop over n items yields f( n ) = n. A loop within a loop yields f( n ) = n2. A loop within a loop within a loop yields f( n ) = n3.

If we have a program that calls a function within a loop and we know the number of instructions the called function performs, it's easy to determine the number of instructions of the whole program. Indeed, let's take a look at this C example:

            int i;
            for ( i = 0; i < n; ++i ) {
                f( n );
            }

If we know that f( n ) is a function that performs exactly n instructions, we can then know that the number of instructions of the whole program is asymptotically n2, as the function is called exactly n times.

Rule of thumb: Given a series of for loops that are sequential, the slowest of them determines the asymptotic behavior of the program. Two nested loops followed by a single loop is asymptotically the same as the nested loops alone, because the nested loops dominate the simple loop.

Now, let's switch over to the fancy notation that computer scientists use. When we've figured out the exact such f asymptotically, we'll say that our program is Θ( f( n ) ). For example, the above programs are Θ( 1 ), Θ( n2 ) and Θ( n2 ) respectively. Θ( n ) is pronounced "theta of n". Sometimes we say that f( n ), the original function counting the instructions including the constants, is Θ( something ). For example, we may say that f( n ) = 2n is a function that is Θ( n ) — nothing new here. We can also write 2n ∈ Θ( n ), which is pronounced as "two n is theta of n". Don't get confused about this notation: All it's saying is that if we've counted the number of instructions a program needs and those are 2n, then the asymptotic behavior of our algorithm is described by n, which we found by dropping the constants. Given this notation, the following are some true mathematical statements:

  1. n6 + 3n ∈ Θ( n6 )
  2. 2n + 12 ∈ Θ( 2n )
  3. 3n + 2n∈ Θ( 3n )
  4. nn + n ∈ Θ( nn )

By the way, if you solved Exercise 1 from above, these are exactly the answers you should have found.

We call this function, i.e. what we put within Θ( here ), the time complexity or just complexity of our algorithm. So an algorithm with Θ( n ) is of complexity n. We also have special names for Θ( 1 ), Θ( n ), Θ( n2 ) and Θ( log( n ) ) because they occur very often. We say that a Θ( 1 ) algorithm is a constant-time algorithm, Θ( n ) is linear, Θ( n2 ) is quadratic and Θ( log( n ) ) is logarithmic (don't worry if you don't know what logarithms are yet – we'll get to that in a minute).

Rule of thumb: Programs with a bigger Θ run slower than programs with a smaller Θ.

Big-O notation

Now, it's sometimes true that it will be hard to figure out exactly the behavior of an algorithm in this fashion as we did above, especially for more complex examples. However, we will be able to say that the behavior of our algorithm will never exceed a certain bound. This will make life easier for us, as we won't have to specify exactly how fast our algorithm runs, even when ignoring constants the way we did before. All we'll have to do is find a certain bound. This is explained easily with an example.

A famous problem computer scientists use for teaching algorithms is the sorting problem. In the sorting problem, an array A of size n is given (sounds familiar?) and we are asked to write a program that sorts this array. This problem is interesting because it is a pragmatic problem in real systems. For example, a file explorer needs to sort the files it displays by name so that the user can navigate them with ease. Or, as another example, a video game may need to sort the 3D objects displayed in the world based on their distance from the player's eye inside the virtual world in order to determine what is visible and what isn't, something called the Visibility Problem (see Figure 3). The objects that turn out to be closest to the player are those visible, while those that are further may get hidden by the objects in front of them. Sorting is also interesting because there are many algorithms to solve it, some of which are worse than others. It's also an easy problem to define and to explain. So let's write a piece of code that sorts an array.

Here is an inefficient way to implement sorting an array in Ruby. (Of course, Ruby supports sorting arrays using build-in functions which you should use instead, and which are certainly faster than what we'll see here. But this is here for illustration purposes.)

                b = []
                n.times do
                    m = a[ 0 ]
                    mi = 0
                    a.each_with_index do |element, i|
                        if element < m
                            m = element
                            mi = i
                        end
                    end
                    a.delete_at( mi )
                    b << m
                end

This method is called selection sort. It finds the minimum of our array (the array is denoted a above, while the minimum value is denoted m and mi is its index), puts it at the end of a new array (in our case b), and removes it from the original array. Then it finds the minimum between the remaining values of our original array, appends that to our new array so that it now contains two elements, and removes it from our original array. It continues this process until all items have been removed from the original and have been inserted into the new array, which means that the array has been sorted. In this example, we can see that we have two nested loops. The outer loop runs n times, and the inner loop runs once for each element of the array a. While the array a initially has n items, we remove one array item in each iteration. So the inner loop repeats n times during the first iteration of the outer loop, then n - 1 times, then n - 2 times and so forth, until the last iteration of the outer loop during which it only runs once.

It's a little harder to evaluate the complexity of this program, as we'd have to figure out the sum 1 + 2 + ... + (n - 1) + n. But we can for sure find an "upper bound" for it. That is, we can alter our program (you can do that in your mind, not in the actual code) to make it worse than it is and then find the complexity of that new program that we derived. If we can find the complexity of the worse program that we've constructed, then we know that our original program is at most that bad, or maybe better. That way, if we find out a pretty good complexity for our altered program, which is worse than our original, we can know that our original program will have a pretty good complexity too – either as good as our altered program or even better.

Let's now think of the way to edit this example program to make it easier to figure out its complexity. But let's keep in mind that we can only make it worse, i.e. make it take up more instructions, so that our estimate is meaningful for our original program. Clearly we can alter the inner loop of the program to always repeat exactly n times instead of a varying number of times. Some of these repetitions will be useless, but it will help us analyze the complexity of the resulting algorithm. If we make this simple change, then the new algorithm that we've constructed is clearly Θ( n2 ), because we have two nested loops where each repeats exactly n times. If that is so, we say that the original algorithm is O( n2 ). O( n2 ) is pronounced "big oh of n squared". What this says is that our program is asymptotically no worse than n2. It may even be better than that, or it may be the same as that. By the way, if our program is indeed Θ( n2 ), we can still say that it's O( n2 ). To help you realize that, imagine altering the original program in a way that doesn't change it much, but still makes it a little worse, such as adding a meaningless instruction at the beginning of the program. Doing this will alter the instruction-counting function by a simple constant, which is ignored when it comes to asymptotic behavior. So a program that is Θ( n2 ) is also O( n2 ).

But a program that is O( n2 ) may not be Θ( n2 ). For example, any program that is Θ( n ) is also O( n2 ) in addition to being O( n ). If we imagine the that a Θ( n ) program is a simple for loop that repeats n times, we can make it worse by wrapping it in another for loop which repeats n times as well, thus producing a program with f( n ) = n2. To generalize this, any program that is Θ( a ) is O( b ) when b is worse than a. Notice that our alteration to the program doesn't need to give us a program that is actually meaningful or equivalent to our original program. It only needs to perform more instructions than the original for a given n. All we're using it for is counting instructions, not actually solving our problem.

So, saying that our program is O( n2 ) is being on the safe side: We've analyzed our algorithm, and we've found that it's never worse than n2. But it could be that it's in fact n2. This gives us a good estimate of how fast our program runs. Let's go through a few examples to help you familiarize yourself with this new notation.

Exercise 3

Find out which of the following are true:

  1. A Θ( n ) algorithm is O( n )
  2. A Θ( n ) algorithm is O( n2 )
  3. A Θ( n2 ) algorithm is O( n3 )
  4. A Θ( n ) algorithm is O( 1 )
  5. A O( 1 ) algorithm is Θ( 1 )
  6. A O( n ) algorithm is Θ( 1 )

Solution

  1. We know that this is true as our original program was Θ( n ). We can achieve O( n ) without altering our program at all.
  2. As n2 is worse than n, this is true.
  3. As n3 is worse than n2, this is true.
  4. As 1 is not worse than n, this is false. If a program takes n instructions asymptotically (a linear number of instructions), we can't make it worse and have it take only 1 instruction asymptotically (a constant number of instructions).
  5. This is true as the two complexities are the same.
  6. This may or may not be true depending on the algorithm. In the general case it's false. If an algorithm is Θ( 1 ), then it certainly is O( n ). But if it's O( n ) then it may not be Θ( 1 ). For example, a Θ( n ) algorithm is O( n ) but not Θ( 1 ).

Exercise 4

Use an arithmetic progression sum to prove that the above program is not only O( n2 ) but also Θ( n2 ). If you don't know what an arithmetic progression is, look it up on Wikipedia– it's easy.

Because the O-complexity of an algorithm gives an upper bound for the actual complexity of an algorithm, while Θ gives the actual complexity of an algorithm, we sometimes say that the Θ gives us a tight bound. If we know that we've found a complexity bound that is not tight, we can also use a lower-case o to denote that. For example, if an algorithm is Θ( n ), then its tight complexity is n. Then this algorithm is both O( n ) and O( n2 ). As the algorithm is Θ( n ), the O( n ) bound is a tight one. But the O( n2 ) bound is not tight, and so we can write that the algorithm is o( n2 ), which is pronounced "small o of n squared" to illustrate that we know our bound is not tight. It's better if we can find tight bounds for our algorithms, as these give us more information about how our algorithm behaves, but it's not always easy to do.

Exercise 5

Determine which of the following bounds are tight bounds and which are not tight bounds. Check to see if any bounds may be wrong. Use o( notation ) to illustrate the bounds that are not tight.

  1. A Θ( n ) algorithm for which we found a O( n ) upper bound.
  2. A Θ( n2 ) algorithm for which we found a O( n3 ) upper bound.
  3. A Θ( 1 ) algorithm for which we found an O( n ) upper bound.
  4. A Θ( n ) algorithm for which we found an O( 1 ) upper bound.
  5. A Θ( n ) algorithm for which we found an O( 2n ) upper bound.

Solution

  1. In this case, the Θ complexity and the O complexity are the same, so the bound is tight.
  2. Here we see that the O complexity is of a larger scale than the Θ complexity so this bound is not tight. Indeed, a bound of O( n2 ) would be a tight one. So we can write that the algorithm is o( n3 ).
  3. Again we see that the O complexity is of a larger scale than the Θ complexity so we have a bound that isn't tight. A bound of O( 1 ) would be a tight one. So we can point out that the O( n ) bound is not tight by writing it as o( n ).
  4. We must have made a mistake in calculating this bound, as it's wrong. It's impossible for a Θ( n ) algorithm to have an upper bound of O( 1 ), as n is a larger complexity than 1. Remember that O gives an upper bound.
  5. This may seem like a bound that is not tight, but this is not actually true. This bound is in fact tight. Recall that the asymptotic behavior of 2n and n are the same, and that O and Θ are only concerned with asymptotic behavior. So we have that O( 2n ) = O( n ) and therefore this bound is tight as the complexity is the same as the Θ.

Rule of thumb: It's easier to figure out the O-complexity of an algorithm than its Θ-complexity.

You may be getting a little overwhelmed with all this new notation by now, but let's introduce just two more symbols before we move on to a few examples. These are easy now that you know Θ, O and o, and we won't use them much later in this article, but it's good to know them now that we're at it. In the example above, we modified our program to make it worse (i.e. taking more instructions and therefore more time) and created the O notation. O is meaningful because it tells us that our program will never be slower than a specific bound, and so it provides valuable information so that we can argue that our program is good enough. If we do the opposite and modify our program to make it better and find out the complexity of the resulting program, we use the notation Ω. Ω therefore gives us a complexity that we know our program won't be better than. This is useful if we want to prove that a program runs slowly or an algorithm is a bad one. This can be useful to argue that an algorithm is too slow to use in a particular case. For example, saying that an algorithm is Ω( n3 ) means that the algorithm isn't better than n3. It might be Θ( n3 ), as bad as Θ( n4 ) or even worse, but we know it's at least somewhat bad. So Ω gives us a lower bound for the complexity of our algorithm. Similarly to ο, we can write ω if we know that our bound isn't tight. For example, a Θ( n3 ) algorithm is ο( n4 ) and ω( n2 ). Ω( n ) is pronounced "big omega of n", while ω( n ) is pronounced "small omega of n".

Exercise 6

For the following Θ complexities write down a tight and a non-tight O bound, and a tight and non-tight Ω bound of your choice, providing they exist.

  1. Θ( 1 )
  2. Θ( sqrt( n ) )
  3. Θ( n )
  4. Θ( n2 )
  5. Θ( n3 )

The reason we use O and Ω instead of Θ even though O and Ω can also give tight bounds is that we may not be able to tell if a bound we've found is tight, or we may just not want to go through the process of scrutinizing it so much.

If you don't fully remember all the different symbols and their uses, don't worry about it too much right now. You can always come back and look them up. The most important symbols are O and Θ.

Also note that although Ω gives us a lower-bound behavior for our function (i.e. we've improved our program and made it perform less instructions) we're still referring to a "worst-case" analysis. This is because we're feeding our program the worst possible input for a given n and analyzing its behavior under this assumption.

The following table indicates the symbols we just introduced and their correspondence with the usual mathematical symbols of comparisons that we use for numbers. The reason we don't use the usual symbols here and use Greek letters instead is to point out that we're doing an asymptotic behavior comparison, not just a simple comparison.

Asymptotic comparison operatorNumeric comparison operator
Our algorithm is o( something )A number is < something
Our algorithm is O( something )A number is something
Our algorithm is Θ( something )A number is = something
Our algorithm is Ω( something )A number is something
Our algorithm is ω( something )A number is > something

Rule of thumb: While all the symbols O, o, Ω, ω and Θ are useful at times, O is the one used more commonly, as it's easier to determine than Θ and more practically useful than Ω.

The log function is much lower than the square root function, which, in turn, is much lower than the linear function even for small n

Logarithms

If you know what logarithms are, feel free to skip this section. As a lot of people are unfamiliar with logarithms, or just haven't used them much recently and don't remember them, this section is here as an introduction for them. This text is also for younger students that haven't seen logarithms at school yet. Logarithms are important because they occur a lot when analyzing complexity. A logarithm is an operation applied to a number that makes it quite smaller – much like a square root of a number. So if there's one thing you want to remember about logarithms is that they take a number and make it much smaller than the original (See Figure 4). Now, in the same way that square roots are the inverse operation of squaring something, logarithms are the inverse operation of exponentiating something. This isn't as hard as it sounds. It's better explained with an example. Consider the equation:

2x = 1024

We now wish to solve this equation for x. So we ask ourselves: What is the number to which we must raise the base 2 so that we get 1024? That number is 10. Indeed, we have 210 = 1024, which is easy to verify. Logarithms help us denote this problem using new notation. In this case, 10 is the logarithm of 1024 and we write this as log( 1024 ) and we read it as "the logarithm of 1024". Because we're using 2 as a base, these logarithms are called base 2 logarithms. There are logarithms in other bases, but we'll only use base 2 logarithms in this article. If you're a student competing in international competitions and you don't know about logarithms, I highly recommend that you practice your logarithms after completing this article. In computer science, base 2 logarithms are much more common than any other types of logarithms. This is because we often only have two different entities: 0 and 1. We also tend to cut down one big problem into halves, of which there are always two. So you only need to know about base-2 logarithms to continue with this article.

Exercise 7

Solve the equations below. Denote what logarithm you're finding in each case. Use only logarithms base 2.

  1. 2x = 64
  2. (22)x = 64
  3. 4x = 4
  4. 2x = 1
  5. 2x + 2x = 32
  6. (2x) * (2x) = 64

Solution

There is nothing more to this than applying the ideas defined above.

  1. By trial and error we can find that x = 6 and so log( 64 ) = 6.
  2. Here we notice that (22)x, by the properties of exponents, can be written as 22x. So we have that 2x = 6 because log( 64 ) = 6 from the previous result and therefore x = 3.
  3. Using our knowledge from the previous equation, we can write 4 as 22 and so our equation becomes (22)x = 4 which is the same as 22x = 4. Then we notice that log( 4 ) = 2 because 22 = 4 and therefore we have that 2x = 2. So x = 1. This is readily observed from the original equation, as using an exponent of 1 yields the base as a result.
  4. Recall that an exponent of 0 yields a result of 1. So we have log( 1 ) = 0 as 20 = 1, and so x = 0.
  5. Here we have a sum and so we can't take the logarithm directly. However we notice that 2x + 2x is the same as 2 * (2x). So we've multiplied in yet another two, and therefore this is the same as 2x + 1 and now all we have to do is solve the equation 2x + 1 = 32. We find that log( 32 ) = 5 and so x + 1 = 5 and therefore x = 4.
  6. We're multiplying together two powers of 2, and so we can join them by noticing that (2x) * (2x) is the same as 22x. Then all we need to do is to solve the equation 22x = 64 which we already solved above and so x = 3.

Rule of thumb: For competition algorithms implemented in C++, once you've analyzed your complexity, you can get a rough estimate of how fast your program will run by expecting it to perform about 1,000,000 operations per second, where the operations you count are given by the asymptotic behavior function describing your algorithm. For example, a Θ( n ) algorithm takes about a second to process the input for n = 1,000,000.

Recursive complexity

Let's now take a look at a recursive function. A recursive function is a function that calls itself. Can we analyze its complexity? The following function, written in Python, evaluates the factorial of a given number. The factorial of a positive integer number is found by multiplying it with all the previous positive integers together. For example, the factorial of 5 is 5 * 4 * 3 * 2 * 1. We denote that "5!" and pronounce it "five factorial" (some people prefer to pronounce it by screaming it out aloud like "FIVE!!!")

                def factorial( n ):
                    if n == 1:
                        return 1
                    return n * factorial( n - 1 )

Let us analyze the complexity of this function. This function doesn't have any loops in it, but its complexity isn't constant either. What we need to do to find out its complexity is again to go about counting instructions. Clearly, if we pass some n to this function, it will execute itself n times. If you're unsure about that, run it "by hand" now for n = 5 to validate that it actually works. For example, for n = 5, it will execute 5 times, as it will keep decreasing n by 1 in each call. We can see therefore that this function is then Θ( n ).

If you're unsure about this fact, remember that you can always find the exact complexity by counting instructions. If you wish, you can now try to count the actual instructions performed by this function to find a function f( n ) and see that it's indeed linear (recall that linear means Θ( n )).

See Figure 5 for a diagram to help you understand the recursions performed when factorial( 5 ) is called.

This should clear up why this function is of linear complexity.

Logarithmic complexity

One famous problem in computer science is that of searching for a value within an array. We solved this problem earlier for the general case. This problem becomes interesting if we have an array which is sorted and we want to find a given value within it. One method to do that is called binary search. We look at the middle element of our array: If we find it there, we're done. Otherwise, if the value we find there is bigger than the value we're looking for, we know that our element will be on the left part of the array. Otherwise, we know it'll be on the right part of the array. We can keep cutting these smaller arrays in halves until we have a single element to look at. Here's the method using pseudocode:

                def binarySearch( A, n, value ):
                    if n = 1:
                        if A[ 0 ] = value:
                            return true
                        else:
                            return false
                    if value < A[ n / 2 ]:
                        return binarySearch( A[ 0...( n / 2 - 1 ) ], n / 2 - 1, value )
                    else if value > A[ n / 2 ]:
                        return binarySearch( A[ ( n / 2 + 1 )...n ], n / 2 - 1, value )
                    else:
                        return true

This pseudocode is a simplification of the actual implementation. In practice, this method is easier described than implemented, as the programmer needs to take care of some implementation issues. There are off-by-one errors and the division by 2 may not always produce an integer value and so it's necessary to floor() or ceil() the value. But we can assume for our purposes that it will always succeed, and we'll assume our actual implementation in fact takes care of the off-by-one errors, as we only want to analyze the complexity of this method. If you've never implemented binary search before, you may want to do this in your favourite programming language. It's a truly enlightening endeavor.

See Figure 6 to help you understand the way binary search operates.

If you're unsure that this method actually works, take a moment now to run it by hand in a simple example and convince yourself that it actually works.

Let us now attempt to analyze this algorithm. Again, we have a recursive algorithm in this case. Let's assume, for simplicity, that the array is always cut in exactly a half, ignoring just now the + 1 and - 1 part in the recursive call. By now you should be convinced that a little change such as ignoring + 1 and - 1 won't affect our complexity results. This is a fact that we would normally have to prove if we wanted to be prudent from a mathematical point of view, but practically it is intuitively obvious. Let's assume that our array has a size that is an exact power of 2, for simplicity. Again this assumption doesn't change the final results of our complexity that we will arrive at. The worst-case scenario for this problem would happen when the value we're looking for does not occur in our array at all. In that case, we'd start with an array of size n in the first call of the recursion, then get an array of size n / 2 in the next call. Then we'll get an array of size n / 4 in the next recursive call, followed by an array of size n / 8 and so forth. In general, our array is split in half in every call, until we reach 1. So, let's write the number of elements in our array for every call:

  1. 0th iteration: n
  2. 1st iteration: n / 2
  3. 2nd iteration: n / 4
  4. 3rd iteration: n / 8
  5. ...
  6. ith iteration: n / 2i
  7. ...
  8. last iteration: 1

Notice that in the i-th iteration, our array has n / 2i elements. This is because in every iteration we're cutting our array into half, meaning we're dividing its number of elements by two. This translates to multiplying the denominator with a 2. If we do that i times, we get n / 2i. Now, this procedure continues and with every larger i we get a smaller number of elements until we reach the last iteration in which we have only 1 element left. If we wish to find i to see in what iteration this will take place, we have to solve the following equation:

1 = n / 2i

This will only be true when we have reached the final call to the binarySearch() function, not in the general case. So solving for i here will help us find in which iteration the recursion will finish. Multiplying both sides by 2i we get:

2i = n

Now, this equation should look familiar if you read the logarithms section above. Solving for i we have:

i = log( n )

This tells us that the number of iterations required to perform a binary search is log( n ) where n is the number of elements in the original array.

If you think about it, this makes some sense. For example, take n = 32, an array of 32 elements. How many times do we have to cut this in half to get only 1 element? We get: 32 → 16 → 8 → 4 → 2 → 1. We did this 5 times, which is the logarithm of 32. Therefore, the complexity of binary search is Θ( log( n ) ).

This last result allows us to compare binary search with linear search, our previous method. Clearly, as log( n ) is much smaller than n, it is reasonable to conclude that binary search is a much faster method to search within an array then linear search, so it may be advisable to keep our arrays sorted if we want to do many searches within them.

Rule of thumb: Improving the asymptotic running time of a program often tremendously increases its performance, much more than any smaller "technical" optimizations such as using a faster programming language.

Optimal sorting

Congratulations. You now know about analyzing the complexity of algorithms, asymptotic behavior of functions and big-O notation. You also know how to intuitively figure out that the complexity of an algorithm is O( 1 ), O( log( n ) ), O( n ), O( n2 ) and so forth. You know the symbols o, O, ω, Ω and Θ and what worst-case analysis means. If you've come this far, this tutorial has already served its purpose.

This final section is optional. It is a little more involved, so feel free to skip it if you feel overwhelmed by it. It will require you to focus and spend some moments working through the exercises. However, it will provide you with a very useful method in algorithm complexity analysis which can be very powerful, so it's certainly worth understanding.

We looked at a sorting implementation above called a selection sort. We mentioned that selection sort is not optimal. An optimal algorithm is an algorithm that solves a problem in the best possible way, meaning there are no better algorithms for this. This means that all other algorithms for solving the problem have a worse or equal complexity to that optimal algorithm. There may be many optimal algorithms for a problem that all share the same complexity. The sorting problem can be solved optimally in various ways. We can use the same idea as with binary search to sort quickly. This sorting method is called mergesort.

To perform a mergesort, we will first need to build a helper function that we will then use to do the actual sorting. We will make a merge function which takes two arrays that are both already sorted and merges them together into a big sorted array. This is easily done:

            def merge( A, B ):
                if empty( A ):
                    return B
                if empty( B ):
                    return A
                if A[ 0 ] < B[ 0 ]:
                    return concat( A[ 0 ], merge( A[ 1...A_n ], B ) )
                else:
                    return concat( B[ 0 ], merge( A, B[ 1...B_n ] ) )

The concat function takes an item, the "head", and an array, the "tail", and builds up and returns a new array which contains the given "head" item as the first thing in the new array and the given "tail" item as the rest of the elements in the array. For example, concat( 3, [ 4, 5, 6 ] ) returns [ 3, 4, 5, 6 ]. We use A_n and B_n to denote the sizes of arrays A and B respectively.

Exercise 8

Verify that the above function actually performs a merge. Rewrite it in your favourite programming language in an iterative way (using for loops) instead of using recursion.

Analyzing this algorithm reveals that it has a running time of Θ( n ), where n is the length of the resulting array (n = A_n + B_n).

Exercise 9

Verify that the running time of merge is Θ( n ).

Utilizing this function we can build a better sorting algorithm. The idea is the following: We split the array into two parts. We sort each of the two parts recursively, then we merge the two sorted arrays into one big array. In pseudocode:

        def mergeSort( A, n ):
            if n = 1:
                return A # it is already sorted
            middle = floor( n / 2 )
            leftHalf = A[ 1...middle ]
            rightHalf = A[ ( middle + 1 )...n ]
            return merge( mergeSort( leftHalf, middle ), mergeSort( rightHalf, n - middle ) )

This function is harder to understand than what we've gone through previously, so the following exercise may take you a few minutes.

Exercise 10

Verify the correctness of mergeSort. That is, check to see if mergeSort as defined above actually correctly sorts the array it is given. If you're having trouble understanding why it works, try it with a small example array and run it "by hand". When running this function by hand, make sure leftHalf and rightHalf are what you get if you cut the array approximately in the middle; it doesn't have to be exactly in the middle if the array has an odd number of elements (that's what floor above is used for).

As a final example, let us analyze the complexity of mergeSort. In every step of mergeSort, we're splitting the array into two halves of equal size, similarly to binarySearch. However, in this case, we maintain both halves throughout execution. We then apply the algorithm recursively in each half. After the recursion returns, we apply the merge operation on the result which takes Θ( n ) time.

So, we split the original array into two arrays of size n / 2 each. Then we merge those arrays, an operation that merges n elements and thus takes Θ( n ) time.

Take a look at Figure 7 to understand this recursion.

Let's see what's going on here. Each circle represents a call to the mergeSort function. The number written in the circle indicates the size of the array that is being sorted. The top blue circle is the original call to mergeSort, where we get to sort an array of size n. The arrows indicate recursive calls made between functions. The original call to mergeSort makes two calls to mergeSort on two arrays, each of size n / 2. This is indicated by the two arrows at the top. In turn, each of these calls makes two calls of its own to mergeSort two arrays of size n / 4 each, and so forth until we arrive at arrays of size 1. This diagram is called a recursion tree, because it illustrates how the recursion behaves and looks like a tree (the root is at the top and the leaves are at the bottom, so in reality it looks like an inversed tree).

Notice that at each row in the above diagram, the total number of elements is n. To see this, take a look at each row individually. The first row contains only one call to mergeSort with an array of size n, so the total number of elements is n. The second row has two calls to mergeSort each of size n / 2. But n / 2 + n / 2 = n and so again in this row the total number of elements is n. In the third row, we have 4 calls each of which is applied on an n / 4-sized array, yielding a total number of elements equal to n / 4 + n / 4 + n / 4 + n / 4 = 4n / 4 = n. So again we get n elements. Now notice that at each row in this diagram the caller will have to perform a merge operation on the elements returned by the callees. For example, the circle indicated with red color has to sort n / 2 elements. To do this, it splits the n / 2-sized array into two n / 4-sized arrays, calls mergeSort recursively to sort those (these calls are the circles indicated with green color), then merges them together. This merge operation requires to merge n / 2 elements. At each row in our tree, the total number of elements merged is n. In the row that we just explored, our function merges n / 2 elements and the function on its right (which is in blue color) also has to merge n / 2 elements of its own. That yields n elements in total that need to be merged for the row we're looking at.

By this argument, the complexity for each row is Θ( n ). We know that the number of rows in this diagram, also called the depth of the recursion tree, will be log( n ). The reasoning for this is exactly the same as the one we used when analyzing the complexity of binary search. We have log( n ) rows and each of them is Θ( n ), therefore the complexity of mergeSort is Θ( n * log( n ) ). This is much better than Θ( n2 ) which is what selection sort gave us (remember that log( n ) is much smaller than n, and so n * log( n ) is much smaller than n * n = n2). If this sounds complicated to you, don't worry: It's not easy the first time you see it. Revisit this section and reread about the arguments here after you implement mergesort in your favourite programming language and validate that it works.

As you saw in this last example, complexity analysis allows us to compare algorithms to see which one is better. Under these circumstances, we can now be pretty certain that merge sort will outperform selection sort for large arrays. This conclusion would be hard to draw if we didn't have the theoretical background of algorithm analysis that we developed. In practice, indeed sorting algorithms of running time Θ( n * log( n ) ) are used. For example, the Linux kernel uses a sorting algorithm called heapsort, which has the same running time as mergesort which we explored here, namely Θ( n log( n ) ) and so is optimal. Notice that we have not proven that these sorting algorithms are optimal. Doing this requires a slightly more involved mathematical argument, but rest assured that they can't get any better from a complexity point of view.

Having finished reading this tutorial, the intuition you developed for algorithm complexity analysis should be able to help you design faster programs and focus your optimization efforts on the things that really matter instead of the minor things that don't matter, letting you work more productively. In addition, the mathematical language and notation developed in this article such as big-O notation is helpful in communicating with other software engineers when you want to argue about the running time of algorithms, so hopefully you will be able to do that with your newly acquired knowledge.

About

This article is licensed under Creative Commons 3.0 Attribution. This means you can copy/paste it, share it, post it on your own website, change it, and generally do whatever you want with it, providing you mention my name. Although you don't have to, if you base your work on mine, I encourage you to publish your own writings under Creative Commons so that it's easier for others to share and collaborate as well. In a similar fashion, I have to attribute the work I used here. The nifty icons that you see on this page are the fugue icons. The beautiful striped pattern that you see in this design was created by Lea Verou. And, more importantly, the algorithms I know so that I was able to write this article were taught to me by my professors Nikos Papaspyrou and Dimitris Fotakis.

I'm currently a cryptography PhD candidate at the University of Athens. When I wrote this article I was an undergraduate Electrical and Computer Engineering undergraduate at the National Technical University of Athens mastering in software and a coach at the Greek Competition in Informatics. Industry-wise I've worked as a member of the engineering team that built deviantART, a social network for artists, at the security teams of Google and Twitter, and two start-ups, Zino and Kamibu where we did social networking and video game development respectively. Follow me on Twitter or on GitHub if you enjoyed this, or mail me if you want to get in touch. Many young programmers don't have a good knowledge of the English language. E-mail me if you want to translate this article into your own native language so that more people can read it.

Thanks for reading. I didn't get paid to write this article, so if you liked it, send me an e-mail to say hello. I enjoy receiving pictures of places around the world, so feel free to attach a picture of yourself in your city!

References

  1. Cormen, Leiserson, Rivest, Stein. Introduction to Algorithms, MIT Press.
  2. Dasgupta, Papadimitriou, Vazirani. Algorithms, McGraw-Hill Press.
  3. Fotakis. Course of Discrete Mathematics at the National Technical University of Athens.
  4. Fotakis. Course of Algorithms and Complexity at the National Technical University of Athens.

PHP in 2018

$
0
0

PHP in 2018 is a talk by PHP creator Rasmus Lerdorf, which focuses on new features in PHP 7.2 and 7.3. We have some exciting low-level performance wins coming to PHP 7.3, which should be out late 2018. It’s highly encouraging that PHP’s focus is mainly on performance in the PHP 7.x releases.

For many in the PHP community 2016 and 2017 was all about getting onto PHP 7. The drastic performance improvements and overall efficiency have resulted in PHP 7 adoption rates well beyond past PHP versions. If you are not on PHP 7 yet, you will learn why you should be, but the talk will focus more on new features in PHP 7.2 and 7.3 along with optimization and static analysis.

For the full slides accompanying this talk, visit http://talks.php.net/concat18/.

Rasmus gives a brief history of PHP, which is now close to a 25-year-old codebase; how it started as a templating tool; and how PHP eventually evolved into a full-featured language.

The brief history sets the stage for Rasmus’ coverage of the significant improvements in performance between PHP 5 and PHP 7, and he goes into in-depth details about performance in PHP.

I found it interesting that leading up to the PHP 7 release we are benefiting from today, the PHP team got help from Intel compiler team (at 7:27) to improve L2 caches and low-level memory.

One of my favorite parts of his talk—which I am sure some will take as a jab at PHP—is that PHP is very beginner-friendly and forgiving, which will only help adoption rates of PHP and Laravel:

PHP runs crappy code really really well. It runs it fast and it works and that’s why PHP has become so popular because you try something and it just works. And heck, is even fast. Very few other languages can say that. It’s not always great, but it really helps people get started with it, and it doesn’t prevent people from writing better code in the future.

The fact that PHP is easy to get started with, coupled with the language’s efforts to improve performance, it bright for the future of PHP developers. At the same time, PHP is a mature programming language that allows beginners to write better code as they grow.

Survivorship bias and startup hype

$
0
0

Luck plays a significant role in business success. Not just in the mere fact of success, but in the magnitude of any given company’s triumphs. We tend to overlook this reality because of a mental distortion called survivorship bias. It is a common cognitive failure, and a dangerous one because it obscures the distastefully harsh nature of the world.

We love to fantasize that emulating the habits of extraordinary entrepreneurs like Bill Gates and Elon Musk will catapult the most talented imitators to the stars. In reality, there are plenty of would-be titans of industry who simply weren’t in the right place at the right time. Even with a great product, they could have failed to make the crucial personal connection that would have accelerated their endeavor to the next level.

Survivorship bias is best summed up by a sardonic XKCD comic: “Never stop buying lottery tickets, no matter what anyone tells you,” the stick figure proclaims. “I failed again and again, but I never gave up. I took extra jobs and poured the money into tickets. And here I am, proof that if you put in the time, it pays off!”

“The hard part is pinning down the cause of a successful startup,” a pseudonymous commenter on Hacker News wisely noted. “Most people just point at highly visible things,” such as hardworking founders or a friendly office culture. “The problem is that this ignores the 5,000 other startups that did all those same things, but failed.”

Ambitious people with incisive minds may be fewer than schmucks, and certainly multi-billionaire CEOs tend to be both brilliant and driven. Yet there are scads of brilliant, driven people who will never make it onto the cover of a prestigious magazine. Or any magazine.

Consider the mythology around hoodie-wearing college dropouts. Y Combinator founder Paul Graham once joked, “I can be tricked by anyone who looks like Mark Zuckerberg.” The quip is funny because it mocks a real tendency among venture capitalists: Pattern-matching to a fault.

In the same vein, a stunning proportion of partners at VC firms graduated from a handful of tony universities, as if the seal on a person’s diploma were what indicated investing abilities. (Granted, the incidence of leveraged social connections and postgraduate degrees may amplify that trend.)

Steve Jobs, along with Zuckerberg and Bill Gates, became fantastically successful after quitting school to start a company. “How many people have followed the Jobs model and failed?” Scientific Americanasked rhetorically in 2014. “Who knows? No one writes books about them and their unsuccessful companies.”

The press inadvertently helps perpetuate survivorship bias. People find famous entrepreneurs fascinating and inspirational, so journalists write about them extensively. The general public is primarily interested in the fates of companies that are household names or close to that status. And of course, reporters themselves are susceptible to survivorship bias just like anyone else. This is reflected in their coverage.

So what’s the antidote? Well, it’s boring: Being careful and thorough. Make sure to look for counterexamples whenever you think you’ve identified a trend or a pattern. Resources do exist, although not always on the first page of Google results.

For example, CB Insights compiled a list of 242 startup postmortems from 2014 through 2017. The analysts wrote, “In the spirit of failure, we dug into the data on startup death and found that 70% of upstart tech companies fail — usually around 20 months after first raising financing (with around $1.3M in total funding closed).”

Most of all, don’t let the headlines rule your worldview. “The press is a lossy and biased compression of events in the actual world, and is singularly consumed with its own rituals, status games, and incentives,” as three-time SaaS founder Patrick McKenzie put it.

Listen to Walter Lippmann, in his 1922 book Public Opinion. “Looking back we can see how indirectly we know the environment in which nevertheless we live,” Lippmann wrote, reflecting on the inaccuracies of tick-tock reporting during World War I. “We can see that the news of it comes to us now fast, now slowly; but that whatever we believe to be a true picture, we treat as if it were the environment itself.”


Hallmark of an Economic Ponzi Scheme

$
0
0

John P. Hussman, Ph.D.
President, Hussman Investment Trust

June 2018


Financial disaster is quickly forgotten. There can be few fields of human endeavor in which history counts for so little as in the world of finance.

– John Kenneth Galbraith

Consider two economic systems.

In one, consumers work for employers to produce products and services. The employees are paid wages and salaries, and business owners earn profits. They use much of that income to purchase the goods and services produced by the economy. They save the remainder. A certain portion of the output represents “investment” goods, which are not consumed, and the portion of income not used for consumption – what we call “saving” – is used to directly or indirectly purchase those investment goods.

There may be some goods that are produced and are not purchased, in which case they become unintended “inventory investment,” but in a general sense, this first economic system is a well-functioning illustration of what we call “circular flow” or “general equilibrium.” As is always the case in the end, income equals expenditure, savings equal investment, and output is absorbed either as consumption or investment.

The second economic system is dysfunctional. Consumers work for employers to produce goods and services, but because of past labor market slack, weak bargaining power, and other factors, they are paid meaningfully less than they actually need to meet their consumption plans. The government also runs massive deficits, partly to supplement the income and medical needs of the public, partly to purchase goods and services from corporations, and partly to directly benefit corporations by cutting taxes on profits (despite being the only country in the OECD where corporations pay no value-added tax).

Meanwhile, lopsided corporate profits generate a great deal of saving for individuals at high incomes, who use these savings to finance government and household deficits through loans. This creation of new debt is required so the economy’s output can actually be absorbed. Businesses also use much of their profits to repurchase their own shares, and engage in what amounts, in aggregate, to a massive debt-for-equity swap with public shareholders: through a series of transactions, corporations issue debt to buy back their shares, and investors use the proceeds from selling those shares, directly or indirectly, but by necessity in equilibrium, to purchase the newly issued corporate debt.

The first of these economic systems is self-sustaining: income from productive activity is used to purchase the output of that productive activity in a circular flow. Debt is used primarily as a means to intermediate the savings of individuals to others who use it to finance productive investment.

The second of these economic systems is effectively a Ponzi scheme: the operation of the economy relies on the constant creation of low-grade debt in order to finance consumption and income shortfalls among some members of the economy, using the massive surpluses earned by other members of the economy. Notably, since securities are assets to the holder and liabilities to the issuer, the growing mountain of debt does not represent “wealth” in aggregate. Rather, securities are the evidence of claims and obligations between different individuals in society, created each time funds are intermediated.

So it’s not just debt burdens that expand. Debt ownership also expands, and the debt deteriorates toward progressively lower quality. The dysfunctional economic system provides the illusion of prosperity for some segments of the economy. But in the end, the underlying instability will, as always, be expressed in the form of mass defaults, which effectively re-align the enormous volume of debt with the ability to service those obligations over the long-term.

This is where we find ourselves, once again.

If you examine financial history, you’ll see how this basic narrative has unfolded time and time again, and is repeated largely because of what Galbraith called “the extreme brevity of the financial memory.” Debt-financed prosperity is typically abetted by central banks that encourage consumers and speculators to borrow (the demand side of Ponzi finance) and also encourage yield-seeking demand among investors for newly-issued debt securities that offer a “pickup” in yield (the supply side of Ponzi finance). The heavy issuance of low-grade debt, and the progressive deterioration in credit quality, ultimately combine to produce a debt crisis, and losses follow that wipe out an enormous amount of accumulated saving and securities value. The strains on the income distribution are partially relieved by borrowers defaulting on their obligations, and bondholders receiving less than they expected.

The hallmark of an economic Ponzi scheme is that the operation of the economy relies on the constant creation of low-grade debt in order to finance consumption and income shortfalls among some members of the economy, using the massive surpluses earned by other members of the economy.

Recall how this dynamic played out during the mortgage bubble and the collapse that followed. After the 2000-2002 recession, the Federal Reserve lowered short-term interest rates to 1%, and investors began seeking out securities that would offer them a “pickup” in yield over safe Treasury securities. They found that alternative in mortgage debt, which up to that time had never encountered a crisis, and was considered to be of the highest investment grade. In response to that yield-seeking demand, Wall Street responded by creating more “product” in the form of mortgage securities. To keep yields relatively high, mortgage loans were made to borrowers of lower and lower credit quality, eventually resulting in interest-only, no-doc, and sub-prime loans. The illusory prosperity of rising prices created the impression that the underlying loans were safe, which extended the speculation, and worsened the subsequent crisis.

Why this time feels different

The current speculative episode has recapitulated many of these features, but it’s tempting to imagine that this time is different. It’s not obvious why this belief persists. Certainly, the equity market valuations we observed at the recent highs weren’t wholly unprecedented – on the most reliable measures, the market reached nearly identical valuations at the 1929 and 2000 pre-crash extremes. Likewise, the extreme speculation in low-grade debt securities is not unprecedented. We saw the same behavior at the peak of the housing bubble in 2006-2007. The duration of this advancing half-cycle has been quite extended, of course, but so was the advance from 1990-2000 and from 1921 to 1929.

My sense is that part of what makes present risks so easy to dismiss is that observers familiar with financial history saw the seeds of yet another emerging bubble years ago, yet the bubble unfolded anyway. Nobody learned anything from the global financial crisis. Indeed, the protections enacted after the crisis are presently being dismantled. Extreme “overvalued, overbought, overbullish” market conditions – which closely preceded the 1987, 2000-2002, and 2007-2009 collapses (and contributed to my own success in market cycles prior to 2009) emerged years ago, encouraging my own early and incorrect warnings about impending risk. Our reliance on those syndromes left us crying wolf for quite some time.

In response, many investors have concluded that all apparent risks can be dismissed. This conclusion will likely prove to be fatal, because it implicitly assumes that if one measure proves unreliable (specifically, those “overvalued, overbought, overbullish” syndromes), then no measure is reliable. Yet aside from the difficulty with those overextended syndromes, other measures (specifically, the combination of valuations and market internals) would have not only captured the bubble advances of recent decades, but would have also anticipated and navigated the subsequent collapses of 2000-2002 and 2007-2009. I expect the same to be true of the collapse that will likely complete the current cycle.

One should remember that my own reputation on that front was rather spectacular in complete market cycles prior to the recent speculative half-cycle. So it’s essential to understand exactly what has been different in the period since 2009, and how we’ve adapted.

Emphatically, historically reliable valuation measures have not become any less useful. Valuations provide enormous information about long-term (10-12 year) returns and potential downside risk over the completion of a given market cycle, but they are often completely useless over shorter segments of the cycle. There is nothing new in this.

Likewise, the uniformity or divergence of market action across a wide range of securities, sectors, industries, and security-types provides enormously useful information about the inclination of investors toward speculation or risk-aversion. Indeed, the entire total return of the S&P 500 over the past decade has occurred in periods where our measures of market internals have been favorable. In contrast, the S&P 500 has lost value, on average, in periods when market internals have been unfavorable, with an interim loss during those periods deeper than -50%. Internals are vastly more useful, in my view, than simple trend-following measures such as 200-day moving averages. There is nothing new in this.

The speculative episode of recent years differed from past cycles only in one feature. In prior market cycles across history, there was always a point when enough was enough. Specifically, extreme syndromes of “overvalued, overbought, overbullish” market action were regularly followed, in short order, by air-pockets, panics, or outright collapses. In the face of the Federal Reserve’s zero interest rate experiment, investors continued to speculate well after those extremes repeatedly emerged. This half-cycle was different in that there was no definable limit to the speculation of investors. One had to wait until market internals deteriorated explicitly, indicating a shift in investor psychology from speculation to risk-aversion, before adopting a negative market outlook.

Understand that point, or nearly two thirds of your paper wealth in stocks, by our estimates, will likely be wiped out over the completion of this market cycle.

One of the outcomes of stress-testing our market risk/return classification methods against Depression-era data in 2009 (after a market collapse that we fully anticipated) was that the resulting methods prioritized “overvalued, overbought, overbullish” features of market action ahead of the condition of market internals. In prior market cycles across history, those syndromes typically emerged just before, or hand-in-hand with deterioration in market internals. Quantitative easing and zero-interest rate policy disrupted that overlap. It was detrimental, in recent years, to adopt a negative market outlook in response to extreme “overvalued, overbought, overbullish” features of market action, as one could have successfully done in prior market cycles across history. That was our Achilles Heel in the face of Fed-induced yield-seeking speculation.

Once interest rates hit zero, there was simply no such thing as “too extreme.” Indeed, as long as one imagined that there was any limit at all to speculation, no incremental adaptation was enough. For our part, we finally threw our hands up late last year and imposed the requirement that market internals must deteriorate explicitly in order to adopt a negative outlook. No exceptions.

The lesson to be learned from quantitative easing, zero-interest rate policy, and the bubble advance of recent years is simple: one must accept that there is no limit at all to the myopic speculation and self-interested amnesia of Wall Street. Bubbles and crashes will repeat again and again, and nothing will be learned from them. However, that does not mean abandoning the information from valuations or market internals. It means refraining from a negative market outlook, even amid extreme valuations and reckless speculation, until dispersion and divergences emerge in market internals (signaling a shift in investor psychology from speculation to risk-aversion). A neutral outlook is fine if conditions are sufficiently overextended, but defer a negative market outlook until market internals deteriorate.

Learn that lesson with us, and you’ll be better prepared not only to navigate future bubbles, but also to avoid being lulled into complacency when the combination of extreme valuations and deteriorating market internals opens up a trap door to subsequent collapse.

This half-cycle was different in that there was no definable limit to the speculation of investors. One had to wait until market internals deteriorated explicitly, indicating a shift in investor psychology from speculation to risk-aversion, before adopting a negative market outlook.

Prioritizing market internals ahead of “overvalued, overbought, overbullish” syndromes addresses the difficulty we encountered in this cycle, yet also preserves the considerations that effectively allowed us to anticipate the 2000-2002 and 2007-2009 collapses.

When extreme valuations are joined by deteriorating market internals (what we used to call “trend uniformity”), downside pressures can increase enormously. Recall my discussion of these considerations in October 2000:

“The information contained in earnings, balance sheets and economic releases is only a fraction of what is known by others. The action of prices and trading volume reveals other important information that traders are willing to back with real money. This is why trend uniformity is so crucial to our Market Climate approach. Historically, when trend uniformity has been positive, stocks have generally ignored overvaluation, no matter how extreme. When the market loses that uniformity, valuations often matter suddenly and with a vengeance. This is a lesson best learned before a crash than after one. Valuations, trend uniformity, and yield pressures are now uniformly unfavorable, and the market faces extreme risk in this environment.”

I emphasized the same considerations in August 2007, just before the global financial crisis:

“Remember, valuation often has little impact on short-term returns (though the impact can be quite violent once internal market action deteriorates, indicating that investors are becoming averse to risk). Still, valuations have an enormous impact on long-term returns, particularly at the horizon of 7 years and beyond. The recent market advance should do nothing to undermine the confidence that investors have in historically reliable, theoretically sound, carefully constructed measures of market valuation. Indeed, there is no evidence that historically reliable valuation measures have lost their validity. Though the stock market has maintained relatively high multiples since the late-1990’s, those multiples have thus far been associated with poor extended returns. Specifically, based on the most recent, reasonably long-term period available, the S&P 500 has (predictably) lagged Treasury bills for not just seven years, but now more than eight-and-a-half years. Investors will place themselves in quite a bit of danger if they believe that the ‘echo bubble’ from the 2002 lows is some sort of new era for valuations.”

It’s very easy to forget that by the 2009 low, investors in the S&P 500 had lost nearly 50%, including dividends, over the preceding 9 years, and had underperformed Treasury bills for nearly 14 years. Yet on the valuation measures we find best correlated with actual subsequent S&P 500 total returns, recent valuation extremes rival or exceed those of 1929 and 2000.

The lesson to be learned from quantitative easing, zero-interest rate policy, and the bubble advance of recent years is simple: one must accept that there is no limit at all to the myopic speculation and self-interested amnesia of Wall Street. Bubbles and crashes will repeat again and again, and nothing will be learned from them.

However, that does not mean abandoning the information from valuations or market internals. It means refraining from a negative market outlook, even amid extreme valuations and reckless speculation, until dispersion and divergences emerge in market internals. A neutral outlook is fine if conditions are sufficiently overextended, but defer a negative market outlook until market internals deteriorate.

At present, our measures of market internals remain unfavorable, as they have been since the week of February 2, and our most reliable measures of valuation remain at offensive extremes. If market internals improve, we’ll immediately adopt a neutral outlook (or possibly even constructive with a strong safety net). Here and now, however, we remain alert that there is an open trap door, in a market that I fully to expect to reach 1100 or lower on the S&P 500 over the completion of this cycle, and to post negative total returns over the coming 12-year horizon.

Remember how market cycles work. There is a durable component to gains, and a transitory component. The durable component is generally represented by gains that take the market up toward reliable historical valuation norms (the green line on the chart below). The transitory component is generally represented by gains that take the market beyond those norms. Based on the measures we find most reliable across history, we presently estimate the threshold between durable and transient to be roughly the 1100 level on the S&P 500, a threshold that we expect to advance by only about 4% annually in the years ahead. Most bear market declines breach those valuation norms, and the ones that don’t (1966, 2002) see those norms breached in a subsequent cycle. We have no expectation that the completion of the current market cycle will be different.

Durable and transient returns

The Ponzi Economy

Let’s return to the concept of a dysfunctional economy, where consumption is largely financed by accumulating debt liabilities to supplement inadequate wages and salaries, where government runs massive fiscal deficits, not only to support the income shortfalls of its citizens, but increasingly to serve and enhance corporate profits themselves, and where corporations enjoy lopsided profits with which they further leverage the economy by engaging in a massive swap of equity with debt.

This setup would be an interesting theoretical study in risk and disequilibrium were it not for the fact that this is actually the situation that presently exists in the U.S. economy.

The chart below shows wages and salaries as a share of GDP. This share reached a record low in late-2011, at the same point that U.S. corporate profits peaked as a share of GDP. That extreme was initially followed by a rebound, but the share has slipped again in the past couple of years.

Wages and salaries as a share of GDP

With the unemployment rate falling to just 3.8% in the May report, inflation in weekly average earnings has pushed up to 3%, and is likely to outpace general price inflation in the coming quarters. Meanwhile, amid the optimism of a 3.8% unemployment rate (matching the rate observed at the 2000 market peak), investors appear to ignore the implication that this has for economic growth. The fact is that nearly half of the economic growth we’ve observed in the U.S. economy in this recovery has been driven by a reduction in the unemployment rate. The red line below shows how the underlying “structural” growth rate of the U.S. economy has slowed in recent decades.

Based on population and demographic factors, even if the unemployment rate remains at 3.8% in 2024, employment growth will contribute just 0.6% annually to GDP growth, leaving productivity growth (averaging well below 1% annually in the recovery since 2010) to contribute the balance. Without the cyclical contribution of a falling unemployment rate, real U.S. economic growth is likely to slow to well-below 2% annually, and even that assumes the economy will avoid a recession in the years ahead.

Structural GDP growth

Wage inflation has been quite limited in the aftermath of job losses during the global financial crisis. Given a tightening labor market, an acceleration of wage gains will be good news for employees, but the delay has contributed to quite a few distortions in the interim.

One clear distortion is that profit margins have been higher and more resilient in this cycle than in prior economic cycles. Again, this elevation of profit margins is a mirror image of slack labor markets and weak growth in wages and salaries. The relationship isn’t perfect, as a result of quarter-to-quarter volatility, but the inverse relationship between the two is clear.

Wages, salaries and profit margins

A good way to understand the relationship between wages and profits is to think in terms of unit labor costs. Consider a generic unit of output. The revenue of generic output is measured by the economy-wide GDP price deflator. The cost of employment embedded into that output is measured by unit labor cost (ULC). Accordingly, we would expect profit margins to increase when unit labor costs rise slower than the GDP deflator, and we would expect profit margins to fall when unit labor costs rise faster than the GDP deflator. That’s exactly what we observe in the data.

Profit margins and unit labor costs - levels

The same relationship can be observed in the way that profits increase and decrease over the economic cycle.

Profit margins and unit labor costs - changes

Now remember how we talked about the “circular flow” of the economy? One consequence of equilibrium, which has to hold even in a dysfunctional economy, is that income is equal to expenditure (remember, we’re including investment, and even unintended inventory accumulation), and savings are equal to investment.

When U.S. corporate profits are unusually high, it’s typically an indication that households and the government are cutting their savings and going into debt.

In an open economy like ours, we can measure not only savings by households and the government, but also the amount of savings that foreigners send to the economy by purchasing securities from us. As it happens, that “inflow” of foreign savings is the mirror image of our current account deficit, because if we don’t pay for our imports by sending foreigners goods and services, it turns out that we pay for them by sending them securities. Because the “balance of payments” always sums to zero, whenever we export securities to foreigners, on balance, we also run a trade deficit. Since real investment in factories, capital goods, and housing has to be financed by savings, you’ll also find that our trade deficit regularly “deteriorates” during U.S. investment booms, and “improves” during recessions.

So here’s an interesting way to think about corporate profits: since gross domestic investment has to be financed by total savings (household, government, foreign, corporate), and because fluctuations in gross domestic investment are largely financed by fluctuations in foreign capital inflows, we would expect corporate profits to be high when the sum of household and government savings is low. Indeed, that’s exactly what we find. [Geek’s note: basically, if dI = dH + dG + dF + dC, and dI ~ dF, then dC ~ -(dH+dG)]

Household savings, government savings, and profit margins

Put simply, when U.S. corporate profits are unusually high, it’s typically an indication that households and the government are cutting their savings and going into debt. Combine this with the fact that corporate profits move inversely to wage and salary income, and it should be evident that the surface prosperity of the U.S. economy masks a Ponzi dynamic underneath. Specifically, corporations are highly profitable precisely because wage and salary growth was deeply depressed by the labor market slack that followed the global financial crisis. In the interim, households have bridged the gap by going increasingly into debt, while government deficits have also increased, both to provide income (and health care) support, and to benefit corporations directly.

Record corporate profits are essentially the upside-down, mirror image of a dysfunctional economy going into extreme indebtedness.

The chart below shows personal saving as a share of GDP. At present, saving is at the lowest level since the “equity extraction” bonanza that accompanied the housing bubble. Only in this instance, the low rate of saving largely reflects depressed incomes rather than extravagant consumption.

Personal savings as a share of wage and salary income

In a Ponzi economy, the gap between income and consumption has to be bridged by increasing levels of debt. The chart below illustrates this dynamic. Total federal public debt now stands at 106% of GDP, and about 77% of GDP if one excludes the Social Security trust fund and other intragovernmental debt. Both figures are the highest in history. Not surprisingly, consumer credit as a share of wage and salary income has also pushed to the highest level in history.

Consumer debt and gross government debt

To put the U.S. federal debt into perspective, only 12 countries have higher ratios of gross government debt to GDP, the largest being Japan, Greece, Italy, and Singapore. The only reason we aren’t as vulnerable to credit strains as say, Italy or Greece, is that those peripheral European countries do not have their own independent central banks and therefore have no “printing press” to backstop their promises. Rather, the European Central Bank can only buy the debt of individual member countries in proportion to their size, unless those countries submit to full austerity plans. That’s why we continue to monitor European banks, many which carry the same level of gross leverage today as U.S. banks prior to the global financial crisis. The most leveraged among them is Deutsche Bank (DB), which plunged to a record low last week, and is particularly worth watching.

Despite record profits, high debt issuance has also infected corporate balance sheets, as companies lever themselves up by repurchasing their own shares. The chart below shows median ratio of debt to revenue among S&P 500 components, as well as the median ratios sorted by quartile. The chart is presented on log scale, with each division showing a doubling in debt/revenue (thanks to our resident math guru Russell Jackson for compiling this data). In recent years, corporate debt has advanced to the highest fraction of revenues in history, nearly tripling from 1985 levels across every quartile.

Median debt/revenue of S&P 500 components

Moody’s observed last week that since 2009, the number of global nonfinancial companies rated as speculative or junk has surged by 58%, to the highest proportion in history. Despite the low rate of defaults at present, Moody’s warns that future periods of economic stress will cause a “particularly large” wave of defaults (h/t Lisa Abramowicz, Jeff Cox).

Without the cyclical contribution of a falling unemployment rate, real U.S. economic growth is likely to slow to well-below 2% annually, and even that assumes the economy will avoid a recession in the years ahead.

The expansion of junk and near-junk credit has again extended to commercial mortgage bonds, where interest-only loans now account for over 75% of the underlying debt. Bloomberg notes that “as investors have flocked to debt investments that seem safe, underwriters have been emboldened to make the instruments riskier and keep yields relatively high by removing or watering down protections.”

Similar deterioration is evident in the $1 trillion market for leveraged loans (loans to already heavily indebted borrowers), where “covenant lite” loans, which offer fewer protections to lenders in the event of default, now account for 77% of loans. Leveraged loans are catching up to the U.S. high-yield market, which accounts for another $1.2 trillion in debt.

Meanwhile, the median corporate credit rating has dropped to BBB- according to S&P Global. That’s just one notch above high yield, speculative-grade junk. Oaktree Capital (where Howard Marks is Co-Chair), told Bloomberg last week that it expects “a flood of troubled credits topping $1 trillion. The supply of low quality debt is significantly higher than prior periods, while the lack of covenant protections makes investing in shaky creditors riskier than ever. Those flows could mean debt will fall into distress quickly.”

Median corporate credit ratings
h/t Jesse Felder

The bottom line is that the combination of wildly experimental monetary policy and subdued growth in wages and salaries in the recovery from the global financial crisis has contributed to a dysfunctional equilibrium, with massive increases in debt burdens at the government, household, and corporate level. The quality of this debt has progressively weakened, both because of lighter covenants and underwriting standards, and because of a more general deterioration in credit ratings and servicing capacity.

Low household savings and growing consumer debt, born of depressed wage and salary compensation, have contributed to temporarily elevated profit margins that investors have treated as permanent. Corporations, enticed by low interest rates, have engaged in a massive leveraged buy-out of stocks, partly to offset dilution from stock grants to executives, and apparently in the misguided belief that valuations and subsequent market returns are unrelated. Equity valuations, on the most reliable measures, rival or exceed those observed at the 1929 and 2000 market extremes. By our estimates, stocks are likely to substantially underperform Treasury bond yields in the coming 10-12 years. Emphatically, valuation extremes cannot be “justified” by low interest rates, because when interest rates are low because growth rates are also low, no valuation premium is “justified” at all.

Estimated S&P 500 equity risk premium

Amid these risks, I’ll emphasize again that our immediate, near-term outlook would become much more neutral (or even constructive with a strong safety net) if an improvement in market internals was to indicate fresh speculative psychology among investors. Still, further speculation would only make the completion of this cycle even worse.

The hallmark of an economic Ponzi scheme is that the operation of the economy relies on the constant creation of low-grade debt in order to finance consumption and income shortfalls among some members of the economy, using the massive surpluses earned by other members of the economy. The debt burdens, speculation, and skewed valuations most responsible for today’s lopsided prosperity are exactly the seeds from which the next crisis will spring.


The foregoing comments represent the general investment analysis and economic views of the Advisor, and are provided solely for the purpose of information, instruction and discourse.

Prospectuses for the Hussman Strategic Growth Fund, the Hussman Strategic Total Return Fund, the Hussman Strategic International Fund, and the Hussman Strategic Dividend Value Fund, as well as Fund reports and other information, are available by clicking “The Funds” menu button from any page of this website.

Estimates of prospective return and risk for equities, bonds, and other financial markets are forward-looking statements based the analysis and reasonable beliefs of Hussman Strategic Advisors. They are not a guarantee of future performance, and are not indicative of the prospective returns of any of the Hussman Funds. Actual returns may differ substantially from the estimates provided. Estimates of prospective long-term returns for the S&P 500 reflect our standard valuation methodology, focusing on the relationship between current market prices and earnings, dividends and other fundamentals, adjusted for variability over the economic cycle.

Usql: Universal Golang CLI for SQL Databases

$
0
0

README.md

A universal command-line interface for PostgreSQL, MySQL, Oracle Database, SQLite3, Microsoft SQL Server, and many other databases including NoSQL and non-relational databases!

Installing | Building | Using | Database Support | Features and Compatibility | Releases

Overview

usql provides a simple way to work with SQL and NoSQL databases via a command-line inspired by PostgreSQL's psql. usql supports most of the core psql features, such as variables, backticks, and commands and has additional features that psql does not, such as syntax highlighting, context-based completion, and multiple database support.

Database administrators and developers that would prefer to work with a tool like psql with non-PostgreSQL databases, will find usql intuitive, easy-to-use, and a great replacement for the command-line clients/tools for other databases.

Installing

usql can be installed by via Release, via Homebrew, or via Go:

Installing via Release

  1. Download a release for your platform
  2. Extract the usql or usql.exe file from the .tar.bz2 or .zip file
  3. Move the extracted executable to somewhere on your $PATH (Linux/macOS) or%PATH% (Windows)

Installing via Homebrew (macOS)

usql is available in the xo/xo tap, and can be installed in the usual way with the brew command:

# add tap
$ brew tap xo/xo# install usql with "most" drivers
$ brew install usql

Additional support for Oracle and ODBC databases can be installed by passing --with-* parameters during install:

# install usql with oracle and odbc support
$ brew install --with-oracle --with-odbc usql

Please note that Oracle support requires using the xo/xo tap'sinstantclient-sdk formula. Any other instantclient-sdk formulae or older versions of the Oracle Instant Client SDK should be uninstalled prior to attempting the above:

# uninstall the instantclient-sdk formula
$ brew uninstall InstantClientTap/instantclient/instantclient-sdk# remove conflicting tap
$ brew untap InstantClientTap/instantclient

Installing via Go

usql can be installed in the usual Go fashion:

# install usql with basic database support (includes PosgreSQL, MySQL, SQLite3, and MS SQL drivers)
$ go get -u github.com/xo/usql

Support for additional databases can be specified with build tags:

# install usql with most drivers (excludes drivers requiring CGO)
$ go get -u -tags most github.com/xo/usql# install usql with all drivers (includes drivers requiring CGO, namely Oracle and ODBC drivers)
$ go get -u -tags all github.com/xo/usql

Building

When building usql with Go, only drivers for PostgreSQL, MySQL, SQLite3 and Microsoft SQL Server will be enabled by default. Other databases can be enabled by specifying the build tag for their database driver. Additionally, the most and all build tags include most, and all SQL drivers, respectively:

# install all drivers
$ go get -u -tags all github.com/xo/usql# install with most drivers (same as all but excludes Oracle/ODBC)
$ go get -u -tags most github.com/xo/usql# install with base drivers and Oracle/ODBC support
$ go get -u -tags 'oracle odbc' github.com/xo/usql

For every build tag <driver>, there is also the no_<driver> build tag disabling the driver:

# install all drivers excluding avatica and couchbase
$ go get -u -tags 'all no_avatica no_couchbase' github.com/xo/usql

Release Builds

Release builds are built with the most build tag. AdditionalSQLite3 build tags are also specified for releases.

Embedding

An effort has been made to keep usql's packages modular, and reusable by other developers wishing to leverage the usql code base. As such, it is possible to embed or create a SQL command-line interface (e.g, for use by some other project as an "official" client) using the core usql source tree.

Please refer to main.go to see how usql puts together its packages. usql's code is also well-documented -- please refer to the GoDoc listing for an overview of the various packages and APIs.

Database Support

usql works with all Go standard library compatible SQL drivers supported bygithub.com/xo/dburl.

The databases supported, the respective build tag, and the driver used by usql are:

Using

After installing, usql can be used similarly to the following:

# connect to a postgres database
$ usql postgres://booktest@localhost/booktest# connect to an oracle database
$ usql oracle://user:pass@host/oracle.sid# connect to a postgres database and run script.sql
$ usql pg://localhost/ -f script.sql

Command-line Options

Supported command-line options:

$ usql --help
usql, the universal command-line interface for SQL databases.

usql 0.7.0
Usage: usql [--command COMMAND] [--file FILE] [--output OUTPUT] [--username USERNAME] [--password] [--no-password] [--no-rc] [--single-transaction] [--set SET] DSN

Positional arguments:
  DSN                    database url

Options:
  --command COMMAND, -c COMMAND
                         run only single command (SQL or internal) and exit
  --file FILE, -f FILE   execute commands from file and exit
  --output OUTPUT, -o OUTPUT
                         output file
  --username USERNAME, -U USERNAME
                         database user name [default: ken]
  --password, -W         force password prompt (should happen automatically)
  --no-password, -w      never prompt for password
  --no-rc, -X            do not read start up file
  --single-transaction, -1
                         execute as a single transaction (if non-interactive)
  --set SET, -v SET      set variable NAME=VALUE
  --help, -h             display this help and exit
  --version              display version and exit

Connecting to Databases

usql opens a database connection by parsing a URL and passing the resulting connection string to a database driver. Database connection strings (aka "data source name" or DSNs) have the same parsing rules as URLs, and can be passed to usql via command-line, or to the \connect or\ccommands.

Connection strings look like the following:

   driver+transport://user:pass@host/dbname?opt1=a&opt2=b
   driver:/path/to/file
   /path/to/file

Where the above are:

ComponentDescription
driverdriver name or alias
transporttcp, udp, unix or driver name (for ODBC and ADODB)
userusername
passpassword
hosthostname
dbname*database name, instance, or service name/ID
?opt1=a&...database driver options (see respective SQL driver for available options)
/path/to/filea path on disk

* for Microsoft SQL Server, the syntax to supply an instance and database name is /instance/dbname, where /instance is optional. For Oracle databases, /dbname is the unique database ID (SID).

Driver Aliases

usql supports the same driver names and aliases from the dburl package. Most databases have at least one or more alias - please refer to thedburl documentation for all supported aliases.

Short Aliases

All database drivers have a two character short form that is usually the first two letters of the database driver. For example, pg for postgres, my formysql, ms for mssql, or for oracle, or sq for sqlite3.

Passing Driver Options

Driver options are specified as standard URL query options in the form of?opt1=a&obt2=b. Please refer to the relevant database driver's documentation for available options.

Paths on Disk

If a URL does not have a driver: scheme, usql will check if it is a path on disk. If the path exists, usql will attempt to use an appropriate database driver to open the path.

If the specified path is a Unix Domain Socket, usql will attempt to open it using the MySQL driver. If the path is a directory, usql will attempt to open it using the PostgreSQL driver. If the path is a regular file, usql will attempt to open the file using the SQLite3 driver.

Driver Defaults

As with URLs, most components in the URL are optional and many components can be left out. usql will attempt connecting using defaults where possible:

# connect to postgres using the local $USER and the unix domain socket in /var/run/postgresql
$ usql pg://

Please see documentation for the database driver you are connecting with for more information.

Connection Examples

The following are example connection strings and additional ways to connect to databases using usql:

# connect to a postgres database
$ usql pg://user:pass@host/dbname
$ usql pgsql://user:pass@host/dbname
$ usql postgres://user:pass@host:port/dbname
$ usql pg://
$ usql /var/run/postgresql# connect to a mysql database
$ usql my://user:pass@host/dbname
$ usql mysql://user:pass@host:port/dbname
$ usql my://
$ usql /var/run/mysqld/mysqld.sock# connect to a mssql (Microsoft SQL) database
$ usql ms://user:pass@host/dbname
$ usql ms://user:pass@host/instancename/dbname
$ usql mssql://user:pass@host:port/dbname
$ usql ms://# connect to a mssql (Microsoft SQL) database using Windows domain authentication
$ runas /user:ACME\wiley /netonly "usql mssql://host/dbname/"# connect to a oracle database
$ usql or://user:pass@host/sid
$ usql oracle://user:pass@host:port/sid
$ usql or://# connect to a cassandra database
$ usql ca://user:pass@host/keyspace
$ usql cassandra://host/keyspace
$ usql cql://host/
$ usql ca://# connect to a sqlite database that exists on disk
$ usql dbname.sqlite3# NOTE: when connecting to a SQLite database, if the "<driver>://" or# "<driver>:" scheme/alias is omitted, the file must already exist on disk.## if the file does not yet exist, the URL must incorporate file:, sq:, sqlite3:,# or any other recognized sqlite3 driver alias to force usql to create a new,# empty database at the specified path:
$ usql sq://path/to/dbname.sqlite3
$ usql sqlite3://path/to/dbname.sqlite3
$ usql file:/path/to/dbname.sqlite3# connect to a adodb ole resource (windows only)
$ usql adodb://Microsoft.Jet.OLEDB.4.0/myfile.mdb
$ usql "adodb://Microsoft.ACE.OLEDB.12.0/?Extended+Properties=\"Text;HDR=NO;FMT=Delimited\""

Executing Queries and Commands

The interactive intrepreter reads queries and meta (\) commands, sending the query to the connected database:

$ usql sqlite://example.sqlite3
Connected with driver sqlite3 (SQLite3 3.17.0)
Type "help"for help.

sq:example.sqlite3=> create table test (test_id int, name string);
CREATE TABLE
sq:example.sqlite3=> insert into test (test_id, name) values (1, 'hello');
INSERT 1
sq:example.sqlite3=>select* from test;
  test_id | name
+---------+-------+
        1 | hello
(1 rows)

sq:example.sqlite3=>select* from test
sq:example.sqlite3->\pselect* from test
sq:example.sqlite3->\g
  test_id | name
+---------+-------+
        1 | hello
(1 rows)

sq:example.sqlite3=>\c postgres://booktest@localhost
error: pq: 28P01: password authentication failed for user "booktest"
Enter password:
Connected with driver postgres (PostgreSQL 9.6.6)
pg:booktest@localhost=>select* from authors;
  author_id |      name
+-----------+----------------+
          1 | Unknown Master
          2 | blah
          3 | aoeu
(3 rows)

pg:booktest@localhost=>

Commands may accept one or more parameter, and can be quoted using either ' or ". Command parameters may also be backtick'd.

Backslash Commands

Currently available commands:

$ usql
Type "help"for help.

(not connected)=>\?
General\q                    quit usql\copyright            show usql usage and distribution terms\drivers              display information about available database drivers\g [FILE] or ;        execute query (and send results to file or |pipe)\gexec                execute query and execute each value of the result\gset [PREFIX]        execute query and store results in usql variables

Help
  \? [commands]         show help on backslash commands\? options            show help on usql command-line options\? variables          show help on special variables

Query Buffer
  \e [FILE] [LINE]      edit the query buffer (or file) with external editor\p                    show the contents of the query buffer\raw                  show the raw (non-interpolated) contents of the query buffer\r                    reset (clear) the query buffer\w FILE               write query buffer to file

Input/Output
  \echo [STRING]        write string to standard output\i FILE               execute commands from file\ir FILE              as \i, but relative to location of current script

Transaction
  \begin                begin a transaction\commit               commit current transaction\rollback             rollback (abort) current transaction

Connection
  \c URL                connect to database with url\c DRIVER PARAMS...   connect to database with SQL driver and parameters\Z                    close database connection\password [USERNAME]  change the password for a user\conninfo             display information about the current database connection

Operating System
  \cd [DIR]             change the current working directory\setenv NAME [VALUE]  set or unset environment variable\! [COMMAND]          execute commandin shell or start interactive shell

Variables
  \prompt [TEXT] NAME   prompt user to set internal variable\set [NAME [VALUE]]   set internal variable, or list all if no parameters\unset NAME           unset (delete) internal variable

Features and Compatibility

The usql project's goal is to support all standard psql commands and features. Pull Requests are always appreciated!

Variables and Interpolation

usql supports client-side interpolation of variables that can be \set and\unset:

$ usql
(not connected)=>\set
(not connected)=>\set FOO bar
(not connected)=>\set
FOO = 'bar'
(not connected)=>\unset FOO
(not connected)=>\set
(not connected)=>

A \set variable, NAME, will be directly interpolated (by string substitution) into the query when prefixed with : and optionally surrounded by quotation marks (' or "):

pg:booktest@localhost=>\set FOO bar
pg:booktest@localhost=>select* from authors where name = :'FOO';
  author_id | name
+-----------+------+
          7 | bar
(1 rows)

The three forms, :NAME, :'NAME', and :"NAME", are used to interpolate a variable in parts of a query that may require quoting, such as for a column name, or when doing concatenation in a query:

pg:booktest@localhost=>\set TBLNAME authors
pg:booktest@localhost=>\set COLNAME name
pg:booktest@localhost=>\set FOO bar
pg:booktest@localhost=>select* from :TBLNAME where :"COLNAME" = :'FOO'
pg:booktest@localhost->\pselect* from authors where "name" = 'bar'
pg:booktest@localhost->\rawselect* from :TBLNAME where :"COLNAME" = :'FOO'
pg:booktest@localhost->\g
  author_id | name
+-----------+------+
          7 | bar
(1 rows)

pg:booktest@localhost=>

Note: variables contained within other strings will NOT be interpolated:

pg:booktest@localhost=> select ':FOO';
  ?column?
+----------+
  :FOO
(1 rows)

pg:booktest@localhost=> \p
select ':FOO';
pg:booktest@localhost=>

Backtick'd parameters

Meta (\) commands support backticks on parameters:

(not connected)=>\echo Welcome `echo $USER` -- 'currently:'"("`date`")"
Welcome ken -- currently: ( Wed Jun 13 12:10:27 WIB 2018 )
(not connected)=>

Backtick'd parameters will be passed to the user's SHELL, exactly as written, and can be combined with \set:

pg:booktest@localhost=>\set MYVAR `date`
pg:booktest@localhost=>\set
MYVAR = 'Wed Jun 13 12:17:11 WIB 2018'
pg:booktest@localhost=>\echo :MYVAR
Wed Jun 13 12:17:11 WIB 2018
pg:booktest@localhost=>

Passwords

usql supports reading passwords for databases from a .usqlpass file contained in the user's HOME directory at startup:

$ cat $HOME/.usqlpass# format is:# protocol:host:port:dbname:user:pass
postgres:*:*:*:booktest:booktest
$ usql pg://
Connected with driver postgres (PostgreSQL 9.6.9)
Type "help"for help.

pg:booktest@=>

Note: the .usqlpass file cannot be readable by other users. Please set the permissions accordingly:

Runtime Configuration (RC) File

usql supports executing a .usqlrc contained in the user's HOME directory:

$ cat $HOME/.usqlrc\echo WELCOME TO THE JUNGLE `date`\set SYNTAX_HL_STYLE paraiso-dark
$ usql
WELCOME TO THE JUNGLE Thu Jun 14 02:36:53 WIB 2018
Type "help"for help.

(not connected)=>\set
SYNTAX_HL_STYLE = 'paraiso-dark'
(not connected)=>

The .usqlrc file is read by usql at startup in the same way as a file passed on the command-line with -f / --file. It is commonly used to set startup environment variables and settings.

You can temporarily disable the RC-file by passing -X or --no-rc on the command-line:

Host Connection Information

By default, usql displays connection information when connecting to a database. This might cause problems with some databases or connections. This can be disabled by setting the system environment variable USQL_SHOW_HOST_INFORMATION to false:

$ export USQL_SHOW_HOST_INFORMATION=false
$ usql pg://booktest@localhost
Type "help"for help.

pg:booktest@=>

SHOW_HOST_INFORMATION is a standard usql variable, and can be \set or \unset. Additionally, it can be passed via the command-line using -v or --set:

$ usql --set SHOW_HOST_INFORMATION=false pg://
Type "help"for help.

pg:booktest@=>\set SHOW_HOST_INFORMATION true
pg:booktest@=>\connect pg://
Connected with driver postgres (PostgreSQL 9.6.9)
pg:booktest@=>

Syntax Highlighting

Interactive queries will be syntax highlighted by default, usingChroma. There are a number of variables that control syntax highlighting:

VariableDefaultValuesDescription
SYNTAX_HLtruetrue or falseenables syntax highlighting
SYNTAX_HL_FORMATdependent on terminal supportformatter nameChroma formatter name
SYNTAX_HL_OVERRIDE_BGtruetrue or falseenables overriding the background color of the chroma styles
SYNTAX_HL_STYLEmonokaistyle nameChroma style name

Time Formatting

Some databases support time/date columns that support formatting. By default, usql formats time/date columns as RFC3339Nano, and can be set using the TIME_FORMAT variable:

$ ./usql pg://
Connected with driver postgres (PostgreSQL 9.6.9)
Type "help"for help.

pg:booktest@=>\set
TIME_FORMAT = 'RFC3339Nano'
pg:booktest@=>selectnow();
                now
+----------------------------------+
  2018-06-14T03:24:12.481923+07:00
(1 rows)

pg:booktest@=>\set TIME_FORMAT Kitchen
pg:booktest@=>\g
   now
+--------+
  3:24AM
(1 rows)

Any Go supported time format or const name (for example, Kitchen, in the above) can be used for TIME_FORMAT.

TODO

usql aims to eventually provide a drop-in replacement for PostgreSQL's psql command. This is on-going -- an attempt has been made in good-faith to provide support for the most frequently used aspects/features of psql. Compatability (where possible) with psql, takes general development priority.

General
  1. updated asciinema demo
  2. support more prompt configuration, colored prompt by default
  3. add window title / status output
  4. change drivers.Convert* to drivers.Marshal style interfaces
  5. allow configuration for JSON encoding/decoding output
  6. return single 'driver' type handling marshaling / scanning of types / columns
  7. implement a table writer that follows "optional func" parameter style, is streaming / handles marshalers, can handle the different configuration options for \pset
  8. implement "extended" display for queries (for \gx / formatting)
  9. implement better environment variable handling
  10. implement proper readline
  11. tab-completion of queries
  12. show hidden (client) queries (\set SHOW_HIDDEN)
  13. fix multiline behavior to mimic psql properly (on arrow up/down through history)
  14. proper PAGER support
  15. \qecho + \o support
  16. context-based completion (WIP)
  17. full \if\elif\else\endif support
  18. fix WITH ... DELETE queries (postgresql)
  19. better --help support/output cli, man pages
  20. translations
  21. \encoding and environment/command line options to set encoding of input (to convert to UTF-8 before feeding to SQL driver) (how important is this ... ?)
Command Processing + psql compatibility
  1. formatting settings (\pset, \a, etc)
  2. all \d* commands from psql (WIP, need to finish work extracting introspection code from xo)
  3. \ef and \ev commands from psql (WIP, need to finish work extracting stored procs / funcs / views for all the major databases)
  4. \watch
  5. \errverbose (show verbose info for last error)
  6. remaining psql cli parameters
  7. \j* commands (WIP)
  8. \copy (add support for copying between two different databases ...?)
Low priority compatibity fixes:
  1. correct operation of interweaved -f/-c commands, ie: usql -f 1 -c 1 -c 2 -f 2 -f 3 -c 3 runs in the specified order
Testing
  1. test suite for databases, doing minimal of SELECT, INSERT, UPDATE, DELETE for every database
Future Database Support
  1. Redis CLI
  2. Native Oracle
  3. InfluxDB
  4. CSV via SQLite3 vtable
  5. Google Spanner
  6. Google Sheets via SQLite3 vtable
  7. Charlatan
  8. InfluxDB IQL
  9. Aerospike AQL
  10. ArrangoDB AQL
  11. OrientDB SQL
  12. Cypher / SparQL
  13. Atlassian JIRA JQL

Related Projects

  • dburl - Go package providing a standard, URL-style mechanism for parsing and opening database connection URLs
  • xo - Go command-line tool to generate Go code from a database schema

Long-term health risks after having adenoids or tonsils removed in childhood

$
0
0

Questions  Are there long-term health risks after having adenoids or tonsils removed in childhood?

Findings  In this population-based cohort study of almost 1.2 million children, removal of adenoids or tonsils in childhood was associated with significantly increased relative risk of later respiratory, allergic, and infectious diseases. Increases in long-term absolute disease risks were considerably larger than changes in risk for the disorders these surgeries aim to treat.

Meaning  The long-term risks of these surgeries deserve careful consideration.

Importance  Surgical removal of adenoids and tonsils to treat obstructed breathing or recurrent middle-ear infections remain common pediatric procedures; however, little is known about their long-term health consequences despite the fact that these lymphatic organs play important roles in the development and function of the immune system.

Objective  To estimate long-term disease risks associated with adenoidectomy, tonsillectomy, and adenotonsillectomy in childhood.

Design, Setting, and Participants  A population-based cohort study of up to 1 189 061 children born in Denmark between 1979 and 1999 and evaluated in linked national registers up to 2009, covering at least the first 10 and up to 30 years of their life, was carried out. Participants in the case and control groups were selected such that their health did not differ significantly prior to surgery.

Exposures  Participants were classified as exposed if adenoids or tonsils were removed within the first 9 years of life.

Main Outcomes and Measures  The incidence of disease (defined by International Classification of Diseases, Eighth Revision [ICD-8] and Tenth Revision [ICD-10] diagnoses) up to age 30 years was examined using stratified Cox proportional hazard regressions that adjusted for 18 covariates, including parental disease history, pregnancy complications, birth weight, Apgar score, sex, socioeconomic markers, and region of Denmark born.

Results  A total of up to 1 189 061 children were included in this study (48% female); 17 460 underwent adenoidectomy, 11 830 tonsillectomy, and 31 377 adenotonsillectomy; 1 157 684 were in the control group. Adenoidectomy and tonsillectomy were associated with a 2- to 3-fold increase in diseases of the upper respiratory tract (relative risk [RR], 1.99; 95% CI, 1.51-2.63 and RR, 2.72; 95% CI, 1.54-4.80; respectively). Smaller increases in risks for infectious and allergic diseases were also found: adenotonsillectomy was associated with a 17% increased risk of infectious diseases (RR, 1.17; 95% CI, 1.10-1.25) corresponding to an absolute risk increase of 2.14% because these diseases are relatively common (12%) in the population. In contrast, the long-term risks for conditions that these surgeries aim to treat often did not differ significantly and were sometimes lower or higher.

Conclusions and Relevance  In this study of almost 1.2 million children, of whom 17 460 had adenoidectomy, 11 830 tonsillectomy, and 31 377 adenotonsillectomy, surgeries were associated with increased long-term risks of respiratory, infectious, and allergic diseases. Although rigorous controls for confounding were used where such data were available, it is possible these effects could not be fully accounted for. Our results suggest it is important to consider long-term risks when making decisions to perform tonsillectomy or adenoidectomy.

Adenoids and tonsils are commonly removed in childhood.1-4 Conventional wisdom suggests their absence has negligible long-term costs,3 but little support for this claim is available beyond estimates of short-term risks. Understanding the longer-term impact of these surgeries is critical because the adenoids and tonsils are parts of the immune system,3,5 have known roles in pathogen detection and defense,3,5 and are usually removed at ages when the development of the immune system is sensitive.6-10 Some single-disease studies have shown subtle short-term changes in risk after surgery,11-14 but no estimates of longer-term risk for a broad range of diseases are available. Here we analyze the long-term risks after surgery for 28 diseases in approximately 1.2 million individuals who were followed from birth up to age 30 years, depending on whether adenoidectomy, tonsillectomy, or adenotonsillectomy occurred during the first 9 years of life.

Current research suggests that tonsils and adenoids play specialized roles in immune system development and function.15 The tonsils protect against pathogens both directly3,5 and indirectly by stimulating other immune responses.3,5,16 The pharyngeal, palatine, and lingual tonsils form Waldeyer’s ring around the apex of the respiratory and digestive tract, providing early warnings for inhaled or ingested pathogens.3,5,16 Evidence now suggests that altering early life immune pathways (including dysbiosis)17 can have lasting effects on adult health, warranting concern that the long-term impact of removing adenoids and tonsils in childhood may not yet be fully appreciated.

Physicians often remove adenoids and tonsils to treat recurrent tonsillitis or middle ear infections. Research on consequences mostly relates to perioperative risks3,18 and short-term changes in the symptoms treated. That tonsils (particularly the adenoids) shrink with age, being largest in children and absent in adults,1 suggests that their absence might not affect adult health.3 However, their activity in early-life could still be critical for normal immune system development,3,5 especially given results on how perturbations to early growth and development alter risk of many adult diseases.19,20

Except for rhinosinusitis, ear and throat infections,21,22 and sleep apnea,23 there has been little work on consequences of removing the adenoids or tonsils in childhood. Evidence that adenoidectomy affects the risk of asthma is mixed.14 Tonsillectomy did not reduce the risk of respiratory diseases in adults, but it may increase inflammatory bowel disease risk,13 and improvements in sleep apnea of children may be less than hoped for.23 Surgery may change the risk of nonrespiratory diseases: tonsillectomy is associated with increased risks for certain cancer types11,24,25 and premature acute myocardial infarctions,12 although mechanistic explanations for these associations remain elusive. Reduction of mucosa-associated pathogens with tonsillectomy has been used to treat kidney disease26,27 although beneficial effects are not consistent.28 These single-disease studies make clear that a comprehensive assessment of long-term health risks is needed.

In this study, we estimated disease risk depending on whether adenoids, tonsils, or both were removed in the first 9 years of life. In contrast to previous single-disease, single-surgery studies of short-term risks, we:

  1. examined effects of all 3 surgeries at ages these are most commonly performed (both generally1,29 and in Denmark) (Figure 1) and most sensitive for immune development;

  2. calculated long-term risks up to age 30 years for 28 diseases in 14 groups;

  3. estimated relative and absolute risks and number of patients needed to treat (NNT) to obtain a first case of harm, to adjust for background rates of disease, and produce clinically applicable numbers;

  4. compared long-term postsurgical absolute risks and benefits for diseases and conditions that these surgeries aim to treat; and

  5. tested for general health differences between those in the case group and those in the control group within the first 9 years of life to establish that individuals who had surgery were not sicklier on average than the controls presurgery.

Study Sample Obtained From the Danish Health Registries

We used data from the Danish Birth Registry of approximately 1.2 million individuals born as singletons between 1979 and 1999 whose health was evaluated up to 2009. To match initial health of cases and controls, we only included those not diagnosed with the outcome diseases prior to surgery in the first 9 years of life (sample sizes presented in eTable 1 in the Supplement). The Danish electronic medical records collected from birth to death reliably sample health sequelae.30,31 Individuals who had surgery after age 9 years were not included; most operations occurred before then (Figure 1). Large sample sizes ensured high statistical power helping to avoid type-2 errors (false-negative resuts). Having access to entire medical histories from birth allowed us to match the health of cases and controls prior to surgery within the first 9 years of life. This reduced potential confounding from reverse causality so that Cox regression became the preferable approach vis-à-vis propensity analysis (eMethods in the Supplement). The many covariates reduced the potential for confounding from those sources. We included individuals with 1 to 21 years of follow-up after age 9 years and those with nonoutlying values for birth weights (1850-5400 g), gestation lengths (30-42 weeks), paternal ages (15-60 years), and maternal ages (15-46 years) at birth. We excluded individuals with missing covariate data and those born before 1979 because their early-life health records were incomplete (eMethods in the Supplement). The characteristics of the study population are shown in the Table.

Covariate data were obtained from the Danish Birth Registry and others: Danish Patient Registry with nationwide hospital admission and ICD-8 and ICD-10 diagnosis data; Danish Psychiatric Registry with psychiatric diagnoses for inpatient admissions; and the Danish Civil Registration and Cause of Death Registries with dates of death, migration, socioeconomic, and other information. We combined individual-level information from different registries using unique deidentified personal identification numbers. Because data are collected for all Danish residents with a personal identification number assigned at birth (or on taking up residency), we are confident that we obtained complete health and socioeconomic histories of the approximately 1.2 million individuals in the analyses.

Of the 3 main types of tonsils—pharyngeal (the adenoids), palatine (the tonsils), and lingual—we focused on surgery removing the first 2 (adenoidectomy, tonsillectomy), because lingual tonsils are not commonly removed, and on adenotonsillectomy, where both are removed in the same surgery.

Surgery codes are based on ICD operation classification codes from Statistics Denmark (up to 1996) and the Nordic Medico-Statistical Committee (NOMESCO) Classification of Surgical Procedures (NCSP) from 1996 onwards including: adenoidectomy, 2618, EMB30; tonsillectomy, 2614, EMB10; adenotonsillectomy, EMB20. Prior to 1996, when there was no code for adenotonsillectomy, we recorded this procedure when both codes (2618, 2614) had matching entry dates.

We selected diseases thought to be affected by changes to immunity (infections, allergies) and other disorders examined in studies of short-term health impacts of these procedures (respiratory infections). We also included broader disease groups (all circulatory, nervous system, endocrine, and autoimmune diseases) because immune dysfunction or dysbiosis could affect many processes (eTable 2 in the Supplement). In Denmark, ICD-8 and ICD-10 codes were used before and after 1994, respectively. To reduce the likelihood of false-negative results, we did analyses of statistical power using R statistical software (version 3.4.1, R Foundation); this excluded some diseases with insufficient outcomes to adequately test the null hypothesis of no association between surgery and incident disease (eMethods in the Supplement).

To account for possibly confounding effects on the prevalence of outcome diseases, we included these covariates in Cox regressions: binary variables for maternal preexisting conditions (eTable 2 in the Supplement) including hypertension (primary or secondary hypertension, hypertensive heart, or renal disease), diabetes (types 1 and 2, malnutrition-related, other or unspecified), previous spontaneous or induced abortions; maternal pregnancy-related variables including gestation length (in weeks) and variables indicating maternal bleeding (hemorrhage, placenta praevia), fetal oxygen deprivation (hypoxia, asphyxia), and pregnancy edema. Parental variables included a binary code for whether either parent had ever been diagnosed within the same disease group as their child (accounting for familial transmission), education (total years summed for both parents), and average income (summed 1979-2009 across both parents). Birth-related variables included birth weight (in grams), season (calendar month, 1-12) and cohort (3-yearly between 1979-1999 accounting for putative changes in diagnostic criteria over time), and Apgar score of 1 to 10 (maximally 2 points for each category) given to newborns at 5 minutes of life ranging from poor to excellent health. Other child-related variables included sex (male, female), nationality (Danish national, immigrant), parity (first, second, third, fourth or higher born), and the region in Denmark (Hovedstaden/Copenhagen, Sjælland, Syddanmark, Midtjylland, or Nordjylland) that individuals had resided in most, accounting for possible regional differences in diagnoses. Accurate data on parental and/or patient smoking status (a potentially important confounder) were not available (ie, only available from 1993 onwards and assessed in a small percentage of parents).

Statistical Design and Analysis

We used Cox regressions to estimate relative risk for the 28 diseases up to age 30 (with age as timescale), depending on whether surgery occurred within the first 9 years of life. Cox regression model assumptions were confirmed and proportional hazards ensured by stratifying for sex, birth cohort, birth season and demographic parity while also accounting for 18 further covariates. To reduce chances of type-1 errors, Cox regression P values were Bonferroni corrected for the 78 analyses performed (Bonferroni-corrected α P value <.05/78 = 0.000641). To provide clinically useful results, absolute risks and number of patients needed to treat (NNT) before causing benefit or harm to one of them were calculated from relative risks and disease prevalence within the first 30 years of life (eMethods in the Supplement).

Each of the 3 surgeries was compared with controls (no surgeries during the study period) after ensuring they were otherwise of comparable health (see Testing for Biases in General Health Before Surgery section). Fewer than 0.2% of individuals in the original sample underwent more than 1 surgery at different times, indicating no need to test for interaction effects between surgeries and later disease risks.

Estimating Risks for Non–Immune Diseases and Conditions That Surgeries Aim to Treat

To weigh potential disease risks against benefits of surgery, we calculated relative risks, absolute risks, and NNTs for the conditions that these surgeries treat using the same samples and statistical setup described herein. Conditions included obstructive sleep apnea, sleep disorders, abnormal breathing, (chronic) sinusitis, otitis media, and (chronic) tonsillitis (eTable 2 in the Supplement). As a control, we tested whether surgeries were associated with diseases unrelated to the immune system, estimating risk for osteoarthritis, cardiac arrhythmias, heart failure, acid-peptic disease and alcoholic hepatitis (eTable 2 in the Supplement) using the same sample and statistical setup described herein. Results (eTable 3 in the Supplement) showed that surgery was not associated with these non–immune diseases up to age 30 years.

Testing for Biases in General Health Before Surgery

With complete medical records from birth, we tested whether general health of cases and controls was different presurgery. The null hypotheses tested were that there was no difference in general health between cases and controls for: (1) age at any disease diagnosis, or (2) age at first diagnosis for diseases recorded before surgery. Neither null hypothesis was rejected, suggesting that cases were no less healthy than controls presurgery in the first 9 years of life. Power analyses confirmed sufficient sample sizes and power to compare general health of those in the case with those in the control groups (eMethods in the Supplement).

Association of Surgery With Risk of Respiratory Disease

Up to 1 189 061 children were analyzed in this study (48% female); 17 460 underwent adenoidectomy, 11 830 tonsillectomy, and 31 377 adenotonsillectomy; 1 157 684 were in the control group (eTable 1 in the Supplement). Tonsillectomy was associated with nearly tripled relative risk of diseases of the upper respiratory tract (RR = 2.72; 95% CI, 1.54-4.80) (Figure 2) (eTables 4 and 5 in the Supplement) with a substantial increase in absolute risk (absolute risk difference [ARD], 18.61%) (eTable 4 in the Supplement) and a small number needed to treat (NNT-harm, 5) (eTable 4 in the Supplement), suggesting that only about 5 tonsillectomies would need to be performed for an additional upper respiratory tract disease to be associated with one of those patients. The degree to which tonsillectomy is associated with this disease in the overall population later in life may therefore be considerable.

Adenoidectomy was associated with more than doubled relative risk of chronic obstructive pulmonary disorder ([COPD]; RR = 2.11; 95% CI, 1.53-2.92) (Figure 2) (eTables 4 and 6 in the Supplement) and nearly doubled relative risk of upper respiratory tract diseases (RR = 1.99; 95% CI, 1.51-2.63) and conjunctivitis (RR = 1.75; 95% CI, 1.35-2.26). This corresponds to a substantial increase in absolute risk for upper respiratory tract diseases (ARD = 10.7%; 95% CI, 5.49-17.56) (eTable 4 in the Supplement), but small increases for COPD (ARD = 0.29%; 95% CI, 0.13-0.48) and conjunctivitis (ARD = 0.16%; 95% CI, 0.07-0.26), consistent with the NNT values (NNT-harm: diseases of upper respiratory tract = 9; COPD = 349; conjunctivitis = 624) (eTable 4 in the Supplement). Although relative risk increases were similar for these diseases, the large differences in absolute risk reflect the prevalence of these disorders in the population. Diseases of the upper respiratory tract occur 40 to 50 times more frequently (in 10.7% of those in the control group aged ≤30 years) than do COPD (0.25%) and conjunctivitis (0.21%).

Other Significant Effects on Long-term Disease Risks

For some diseases, even modest increases in relative risk (RR, 1.17-1.65) resulted in relatively large increases in absolute risk (2%-9%) and low NNTs (NNT-harm <50) because of the high prevalence of these diseases in the population (control risk, 5%-20%) (eTable 4 in the Supplement). These were mainly respiratory diseases (groups: all, lower, lower-chronic, asthma, pneumonia), infectious/parasitic diseases (all), skin diseases (all), musculoskeletal (all), and eye/adnexa (all). For example, adenotonsillectomy was significantly associated with 17% increased relative risk of infectious diseases (RR = 1.17; 95% CI, 1.10-1.25) (eTables 4 and 7 in the Supplement). However, because infectious diseases are relatively common (12%) (eTable 4 in the Supplement), the absolute risk increase of 2.14% was lower, but still suggested approximately 47 adenotonsillectomies would need to be performed for an extra infectious disease to be associated with one of those patients (eTable 4 in the Supplement).

When all 28 disease groups were considered, there were small but significant increases in relative risk for 78% of them after Bonferroni correction. The negative health consequences of these surgeries within the first 30 years of life thus appear to be consistent, affecting a range of tissues and organ systems. This highlights the importance of adenoids and tonsils for normal immune system development and suggests that their early-life removal may slightly but significantly perturb many processes important for later-life health.

Later-Life Risk of Conditions That Surgeries Directly Aimed to Treat Were Mixed

Risks for conditions that surgeries aimed to treat were mixed (eTable 8 in the Supplement). Surgery was associated with significantly reduced long-term relative risk for 7 of 21 conditions (33% of our disease-specific analyses), with no changes for 9 (43%) other conditions and significant increases for 5 (24%).

For example, adenoidectomy was associated with significantly reduced relative risk for sleep disorders (RR = 0.30; 95% CI, 0.15-0.60; ARD = −0.083%; 95% CI, −0.10 to −0.05), and all surgeries were associated with significantly reduced risk for tonsillitis and chronic tonsillitis (ie, RR = 0.09-0.54; ARD, −0.29% to −2.10%). For abnormal breathing, there was no significant change in relative risk up to 30 years of age after any surgery and no change in relative risk for sinusitis after adenoidectomy or tonsillectomy. Conditions where relative risk significantly increased included otitis media, which showed a 2- to 5-fold increase postsurgery (RR, 2.06-4.84; ARD, 5.3%-19.4%), and sinusitis, which increased significantly after adenotonsillectomy (RR = 1.68; 95% CI, 1.32-2.14; ARD = 0.11%; 95% CI, 0.05-0.19) (eDiscussion in the Supplement).

Thus, short-term health benefits of these surgeries for some conditions may not continue up to age 30 years. Indeed, apart from the consistently reduced risk for tonsillitis (after any surgeries) and sleep disorders (after adenoidectomy), longer-term risks for abnormal breathing, sinusitis, chronic sinusitis, and otitis media were either significantly higher after surgery or not significantly different.

Risk Patterns for Covariates

The many associations between disease risk and covariates highlight the complexity of the factors affecting diseases (Figure 3) (eTables 5-7 in the Supplement). Consider those significantly associated with upper respiratory tract diseases (Figure 3) and their largest increases in relative (RR, 1.99-2.72) and absolute risks (ARD, 10.77%-18.61%) after adenoidectomy and tonsillectomy (Figure 2). Risks for these diseases slightly but significantly decreased for offspring born to older mothers (RR = 0.96; 95% CI, 0.95-0.98; both surgeries), slightly increased (tonsillectomies) when maternal bleeding occurred during pregnancy (RR = 1.07; 95% CI, 1.03-1.12), increased (both analyses) with Apgar score (RR = 1.09; 95% CI, 1.04-1.13, both surgeries), increased (both analyses) when mothers had a previous induced abortion (RR = 1.09; 95% CI, 1.06-1.12; both surgeries), increased in immigrants relative to Danish nationals (RR = 1.40; 95% CI, 1.33-1.47; both surgeries), decreased in those living anywhere in Denmark other than Copenhagen (RR, 0.69-0.93), and increased when fathers or mothers had a history of the same disease (RR, 1.29-1.38). Parental history of disease was significantly associated with prevalence in children for almost all diseases (RR, 1.10-3.71).

Parental education, income, and country of origin had many significant effects, but risk direction varied depending on the disease considered and were generally modest, consistent with free health care for all residents in Denmark. For example, mental disorders were less frequent in Danish nationals than immigrants (RR, 0.48-0.49), but influenza risk was higher in Danes (RR, 1.89-2.06). Endocrine and mental diseases were associated with many covariates suggesting complex causation. We discuss other associations with covariates in the eResults in the Supplement.

We estimated relative risks, absolute risks, and number needed to treat to gain a balanced view of how adenoidectomy and tonsillectomy performed between birth and 9 years were associated with disease up to age 30 years in Denmark. Disease risks typically increased after surgery and for some disorders relative risks translated into substantial changes in absolute risk; for these, low NNT values suggested that only a few surgeries would need to be performed for an extra case of disease to be associated with one of those patients.

Although otorhinolaryngologists are sensitive to short-term consequences of procedures for the symptoms that they treat,18,32-34 they have had no evidence to evaluate the full range of long-term risks. Using the Danish public health data allowed us to control for many medical, socioeconomic, and statistical confounders so that credible estimates of long-term risks of surgery could be made. We found that tonsillectomy was associated with a nearly tripled risk of upper respiratory tract diseases, and that adenoidectomy was associated with doubled risk of COPD and upper respiratory tract diseases and nearly doubled risk of conjunctivitis. Large increases in absolute risk for upper respiratory tract diseases also occurred. Smaller elevated risks for a broad range of other diseases translated into detectable increases in absolute disease risks with high prevalence in the population (infectious/parasitic, skin, musculoskeletal, and eye/adnexa diseases). These findings add to previous research on single diseases that showed increased risks of breast cancer11 and premature acute myocardial infarctions12 associated with these surgeries. In contrast, the long-term benefits of surgery were generally minor and provided a neutral spectrum of sometimes decreasing and sometimes increasing risk for the conditions they aimed to treat.

Our results raise the important issue of when the benefits of operating outweigh overall short- and long-term morbidity risks. For much of the past century these operations were common, but they have declined recently35,36 with the emergence of alternative treatments for infections in ear, oral, and nasal cavities, coinciding with heightened appreciation of the short-term risks of surgery.37 The long-term risk associations presented herein add a new perspective to these considerations. They suggest that revived discussion may be timely, because these surgical procedures remain among the most common medical interventions in childhood.3,4 It is important to note that the cumulative long-term impact of surgery depends on the prevalence of specific conditions in the population because these trends are not straightforward to extrapolate from relative risks. Thus, the potential impacts of tonsillectomy and adenoidectomy on the absolute risk of upper respiratory tract diseases were substantial because these conditions were prevalent, whereas those of adenoidectomy on the absolute risks of COPD and conjunctivitis were small because those diseases have low prevalence.

Apart from the specific cases above, our results suggest a more general association between removal of immune organs in the upper respiratory tract during childhood and increased risk of infectious/parasitic diseases later in life. Given that tonsils and adenoids are part of the lymphatic system and play a key role both in the normal development of the immune system and in pathogen screening during childhood and early-life,3 it is not surprising that their removal may impair pathogen detection and increase risk of later respiratory and infectious diseases. However, the associations between these surgeries and diseases of the skin, eyes, and musculoskeletal system are not likely to be directly linked to removal of the tonsils or adenoids and need further investigation. The growing body of research on developmental origins of disease19,38 has convincingly demonstrated that even small perturbations to fetal and childhood growth and development can have lifelong consequences for general health.

Our study did not address risks of diseases in those older than 30 years, the limit of our sample, and even though records of the entire population of Denmark were available, we did not have large enough samples for rarer diseases to obtain reliable risk estimates. A strength of our study is its large coverage of a relatively homogeneous population with equal access to health care irrespective of socioeconomic status, but this may mean that some results will not generalize to other populations. Although many controls were employed to minimize confounding and reverse causation between surgery and disease risk, it is possible that we could not completely remove these effects. Because this study is the first to assess long-term risks associated with these surgeries, we could not compare our results with other studies. We therefore recommend additional studies to validate our findings. We could not include parental smoking data in our analyses as a potential confounding effect, which is a limitation for assessing offspring respiratory disease risk.39 However, we note that our parental education covariate is correlated with smoking, and should thus have partially covered risks of exposure to parental smoking during childhood.40,41 The socioeconomic variables that we were able to include were also quantitative and available without missing values, whereas smoking scores are often self-reported and of more dubious quality.42

To our knowledge, this is the first study to estimate long-term disease associations with early-life tonsillectomies and adenoidectomies for a broad range of diseases. Risks were significant for many diseases and large for some. We showed that absolute risks and the number of patients needed to treat before enhanced health risks later in life become apparent were more consistent and widespread than the immediate population-wide benefits of childhood surgery for subsequent health within the first 30 years of life. The associations that we uncovered in the Danish population appear to warrant renewed evaluation of potential alternatives to surgery.

Corresponding Authors: Sean G. Byars, PhD, Melbourne Integrative Genomics, School of BioSciences, Building 184, The University of Melbourne, Victoria 3010, Australia (sean.byars@unimelb.edu.au).

Accepted for Publication: March 19, 2018.

Published Online: June 7, 2018. doi:10.1001/jamaoto.2018.0614

Author Contributions: Dr Byars had full access to all of the data in the study and takes responsibility for the integrity of the data and the accuracy of the data analysis.

Study concept and design: All authors.

Acquisition, analysis, or interpretation of data: Byars, Boomsma.

Drafting of the manuscript: Byars, Boomsma.

Critical revision of the manuscript for important intellectual content: All authors.

Statistical analysis: Byars.

Obtained funding: Boomsma.

Administrative, technical, or material support: Boomsma.

Study supervision: Stearns, Boomsma.

Conflict of Interest Disclosures: All authors have completed and submitted the ICMJE Form for Disclosure of Potential Conflicts of Interest and none were reported.

Funding/Support: The Centre for Social Evolution and its Evolutionary Medicine program were funded by a grant from the Danish National Research Foundation to J.J. Boomsma (grant number DNRF57). S. G. Byars was also funded by a Marie Curie International Incoming Fellowship (grant number FP7-PEOPLE-2010-IIF-276565).

Additional Information: Data were made available by public authorities in accordance with The Danish Act on Processing of Personal Data (Act No. 429 of 31 May 2000) and deposited under terms of a contract at Statistics Denmark (https://www.dst.dk). They cannot leave the servers at Statistics Denmark. Access to the data used here can be granted to other researchers through an affiliation with the Centre for Social Evolution, University of Copenhagen, if approved by Statistics Denmark. For further information please contact Professor Jacobus J Boomsma, Centre for Social Evolution (JJBoomsma@bio.ku.dk) and the Head of Division for Research Services, Ivan Thaulow (ITH@DST.dk), Statistics Denmark.

Additional Contributions: Statistics Denmark provided access to all deidentified data hosted on a secure computer server. We thank Birgitte Hollegaard, PhD, Copenhagen University, for assistance in gaining access to data; Charlotte Nielsen, PhD, and Morten Lindboe at Statistics Denmark for facilitating data access and technical support. We thank Professor Ruslan Medzhitov, PhD; Dr James Childs, ScD; both at Yale University; and Dr Jay F. Piccirillo, MD, Washington University; Dr Louise Davies, MD, Dartmouth Institute; and 3 anonymous reviewers for comments on previous versions of this study.

1.
Casselbrant ML.  What is wrong in chronic adenoiditis/tonsillitis anatomical considerations.  Int J Pediatr Otorhinolaryngol. 1999;49(suppl 1):S133-S135.PubMedGoogle ScholarCrossref
2.
Kvaerner KJ, Nafstad  P, Jaakkola  JJ.  Otolaryngological surgery and upper respiratory tract infections in children: an epidemiological study.  Ann Otol Rhinol Laryngol. 2002;111(11):1034-1039.PubMedGoogle ScholarCrossref
4.
Baugh RF, Archer  SM, Mitchell  RB,  et al; American Academy of Otolaryngology-Head and Neck Surgery Foundation.  Clinical practice guideline: tonsillectomy in children.  Otolaryngol Head Neck Surg. 2011;144(1)(suppl):S1-S30.PubMedGoogle ScholarCrossref
5.
Brandtzaeg P.  Immunology of tonsils and adenoids: everything the ENT surgeon needs to know.  Int J Pediatr Otorhinolaryngol. 2003;67(suppl 1):S69-S76.PubMedGoogle ScholarCrossref
8.
Sharma AA, Jen  R, Butler  A, Lavoie  PM.  The developing human preterm neonatal immune system: a case for more research in this area.  Clin Immunol. 2012;145(1):61-68.PubMedGoogle ScholarCrossref
9.
Simon AK, Hollander  GA, McMichael  A.  Evolution of the immune system in humans from infancy to old age.  Proc Biol Sci. 2015;282(1821):20143085.Google ScholarCrossref
10.
West LJ.  Defining critical windows in the development of the human immune system.  Hum Exp Toxicol. 2002;21(9-10):499-505.PubMedGoogle ScholarCrossref
11.
Brasky TM, Bonner  MR, Dorn  J,  et al.  Tonsillectomy and breast cancer risk in the Western New York Diet Study.  Cancer Causes Control. 2009;20(3):369-374.PubMedGoogle ScholarCrossref
12.
Janszky I, Mukamal  KJ, Dalman  C, Hammar  N, Ahnve  S.  Childhood appendectomy, tonsillectomy, and risk for premature acute myocardial infarction—a nationwide population-based cohort study.  Eur Heart J. 2011;32(18):2290-2296.PubMedGoogle ScholarCrossref
13.
Johansson E, Hultcrantz  E.  Tonsillectomy—clinical consequences twenty years after surgery?  Int J Pediatr Otorhinolaryngol. 2003;67(9):981-988.PubMedGoogle ScholarCrossref
14.
Mattila PS, Hammarén-Malmi  S, Pelkonen  AS,  et al.  Effect of adenoidectomy on respiratory function: a randomised prospective study.  Arch Dis Child. 2009;94(5):366-370.PubMedGoogle ScholarCrossref
15.
Layton TB.  What can we do to diminish the number of tonsil operations.  Lancet. 1934;223(5760):117-119.Google ScholarCrossref
16.
Kato A, Hulse  KE, Tan  BK, Schleimer  RP.  B-lymphocyte lineage cells and the respiratory system.  J Allergy Clin Immunol. 2013;131(4):933-957.PubMedGoogle ScholarCrossref
17.
Donaldson GP, Lee  SM, Mazmanian  SK.  Gut biogeography of the bacterial microbiota.  Nat Rev Microbiol. 2016;14(1):20-32.PubMedGoogle ScholarCrossref
18.
Subramanyam R, Varughese  A, Willging  JP, Sadhasivam  S.  Future of pediatric tonsillectomy and perioperative outcomes.  Int J Pediatr Otorhinolaryngol. 2013;77(2):194-199.PubMedGoogle ScholarCrossref
19.
Gluckman PD, Hanson  MA.  Developmental origins of health and disease. Cambridge, England: Cambridge University Press; 2006.Crossref
20.
Hanson MA, Gluckman  PD.  Developmental origins of health and disease: new insights.  Basic Clin Pharmacol Toxicol. 2008;102(2):90-93.PubMedGoogle ScholarCrossref
21.
Brietzke SE, Brigger  MT.  Adenoidectomy outcomes in pediatric rhinosinusitis: a meta-analysis.  Int J Pediatr Otorhinolaryngol. 2008;72(10):1541-1545.PubMedGoogle ScholarCrossref
22.
Buskens E, van Staaij  B, van den Akker  J, Hoes  AW, Schilder  AG.  Adenotonsillectomy or watchful waiting in patients with mild to moderate symptoms of throat infections or adenotonsillar hypertrophy: a randomized comparison of costs and effects.  Arch Otolaryngol Head Neck Surg. 2007;133(11):1083-1088.PubMedGoogle ScholarCrossref
23.
Friedman M, Wilson  M, Lin  HC, Chang  HW.  Updated systematic review of tonsillectomy and adenoidectomy for treatment of pediatric obstructive sleep apnea/hypopnea syndrome.  Otolaryngol Head Neck Surg. 2009;140(6):800-808.PubMedGoogle ScholarCrossref
24.
Vestergaard H, Westergaard  T, Wohlfahrt  J, Hjalgrim  H, Melbye  M.  Tonsillitis, tonsillectomy and Hodgkin’s lymphoma.  Int J Cancer. 2010;127(3):633-637.PubMedGoogle ScholarCrossref
25.
Sun LM, Chen  HJ, Li  TC, Sung  FC, Kao  CH.  A nationwide population-based cohort study on tonsillectomy and subsequent cancer incidence.  Laryngoscope. 2015;125(1):134-139.PubMedGoogle ScholarCrossref
26.
Maeda I, Hayashi  T, Sato  KK,  et al.  Tonsillectomy has beneficial effects on remission and progression of IgA nephropathy independent of steroid therapy.  Nephrol Dial Transplant. 2012;27(7):2806-2813.PubMedGoogle ScholarCrossref
27.
Liu LL, Wang  LN, Jiang  Y,  et al.  Tonsillectomy for IgA nephropathy: a meta-analysis.  Am J Kidney Dis. 2015;65(1):80-87.PubMedGoogle ScholarCrossref
28.
Feehally J, Coppo  R, Troyanov  S,  et al; VALIGA study of ERA-EDTA Immunonephrology Working Group.  Tonsillectomy in a European cohort of 1,147 patients with IgA nephropathy.  Nephron. 2016;132(1):15-24.PubMedGoogle ScholarCrossref
29.
Erickson BK, Larson  DR, St Sauver  JL, Meverden  RA, Orvidas  LJ.  Changes in incidence and indications of tonsillectomy and adenotonsillectomy, 1970-2005.  Otolaryngol Head Neck Surg. 2009;140(6):894-901.PubMedGoogle ScholarCrossref
30.
Schmidt M, Schmidt  SA, Sandegaard  JL, Ehrenstein  V, Pedersen  L, Sørensen  HT.  The Danish National Patient Registry: a review of content, data quality, and research potential.  Clin Epidemiol. 2015;7:449-490.PubMedGoogle ScholarCrossref
31.
Thygesen LC, Daasnes  C, Thaulow  I, Brønnum-Hansen  H.  Introduction to Danish (nationwide) registers on health and social issues: structure, access, legislation, and archiving.  Scand J Public Health. 2011;39(7)(suppl):12-16.PubMedGoogle ScholarCrossref
32.
Brietzke SE, Gallagher  D.  The effectiveness of tonsillectomy and adenoidectomy in the treatment of pediatric obstructive sleep apnea/hypopnea syndrome: a meta-analysis.  Otolaryngol Head Neck Surg. 2006;134(6):979-984.PubMedGoogle ScholarCrossref
33.
Paradise JL, Bluestone  CD, Rogers  KD,  et al.  Efficacy of adenoidectomy for recurrent otitis media in children previously treated with tympanostomy-tube placement. Results of parallel randomized and nonrandomized trials.  JAMA. 1990;263(15):2066-2073.PubMedGoogle ScholarCrossref
34.
van den Aardweg MT, Boonacker  CW, Rovers  MM, Hoes  AW, Schilder  AG.  Effectiveness of adenoidectomy in children with recurrent upper respiratory tract infections: open randomised controlled trial.  BMJ. 2011;343:d5154.PubMedGoogle ScholarCrossref
35.
Curtin JM.  The history of tonsil and adenoid surgery.  Otolaryngol Clin North Am. 1987;20(2):415-419.PubMedGoogle Scholar
36.
Grob GN.  The rise and decline of tonsillectomy in twentieth-century America.  J Hist Med Allied Sci. 2007;62(4):383-421.PubMedGoogle ScholarCrossref
37.
Randall DA, Hoffer  ME.  Complications of tonsillectomy and adenoidectomy.  Otolaryngol Head Neck Surg. 1998;118(1):61-68.PubMedGoogle ScholarCrossref
38.
Wadhwa PD, Buss  C, Entringer  S, Swanson  JM.  Developmental origins of health and disease: brief history of the approach and current focus on epigenetic mechanisms.  Semin Reprod Med. 2009;27(5):358-368.PubMedGoogle ScholarCrossref
39.
Pattenden S, Antova  T, Neuberger  M,  et al.  Parental smoking and children’s respiratory health: independent effects of prenatal and postnatal exposure.  Tob Control. 2006;15(4):294-301.PubMedGoogle ScholarCrossref
40.
Osler M, Gerdes  LU, Davidsen  M,  et al.  Socioeconomic status and trends in risk factors for cardiovascular diseases in the Danish MONICA population, 1982-1992.  J Epidemiol Community Health. 2000;54(2):108-113.PubMedGoogle ScholarCrossref
41.
Gilman SE, Martin  LT, Abrams  DB,  et al.  Educational attainment and cigarette smoking: a causal association?  Int J Epidemiol. 2008;37(3):615-624.PubMedGoogle ScholarCrossref
42.
Newell SA, Girgis  A, Sanson-Fisher  RW, Savolainen  NJ.  The accuracy of self-reported health behaviors and risk factors relating to cancer and cardiovascular disease in the general population: a critical review.  Am J Prev Med. 1999;17(3):211-229.PubMedGoogle ScholarCrossref

Show HN: World Cup API for 2018

$
0
0

This is an API for the World Cup (and now, Women's World Cup!) ((and now the World Cup in 2018!)) that scrapes current match results and outputs match data as JSON. No guarantees are made as to its accuracy, but we will do our best to keep it up to date. For example responses, including events such as goals, substitutions, and cards, see the GitHub page.

Datasets for Machine Learning

$
0
0

What are some open datasets for machine learning? We at Gengo decided to create the ultimate cheat sheet for high quality datasets. These range from the vast (looking at you, Kaggle) or the highly specific (data for self-driving cars).

First, a couple of pointers to keep in mind when searching for datasets. According to Dataquest:

  • A dataset shouldn’t be messy, because you don’t want to spend a lot of time cleaning data.
  • A dataset shouldn’t have too many rows or columns, so it’s easy to work with.
  • The cleaner the data, the better — cleaning a large data set can be very time consuming.
  • There should be an interesting question that can be answered with the data.

Let’s get to it!

Dataset Finders

Kaggle: A data science site that contains a variety of externally-contributed interesting datasets. You can find all kinds of niche datasets in its master list, from ramen ratings to basketball data to and even seattle pet licenses.

UCI Machine Learning Repository: One of the oldest sources of datasets on the web, and a great first stop when looking for interesting datasets. Although the data sets are user-contributed, and thus have varying levels of cleanliness, the vast majority are clean. You can download data directly from the UCI Machine Learning repository, without registration.

General Datasets

Public Government datasets

Data.gov: This site makes it possible to download data from multiple US government agencies. Data can range from government budgets to school performance scores. Be warned though: much of the data requires additional research.

Food Environment Atlas: Contains data on how local food choices affect diet in the US.

School system finances: A survey of the finances of school systems in the US.

Chronic disease data: Data on chronic disease indicators in areas across the US.

The US National Center for Education Statistics: Data on educational institutions and education demographics from the US and around the world.

The UK Data Centre: The UK’s largest collection of social, economic and population data.

Data USA: A comprehensive visualization of US public data.

Finance & Economics

Quandl: A good source for economic and financial data – useful for building models to predict economic indicators or stock prices.

World Bank Open Data: Datasets covering population demographics and a huge number of economic and development indicators from across the world.

IMF Data: The International Monetary Fund publishes data on international finances, debt rates, foreign exchange reserves, commodity prices and investments.

Financial Times Market Data: Up to date information on financial markets from around the world, including stock price indexes, commodities and foreign exchange.

Google Trends: Examine and analyze data on internet search activity and trending news stories around the world.

American Economic Association (AEA): A good source to find US macroeconomic data.

Machine Learning Datasets:

Images

Labelme: A large dataset of annotated images.

ImageNet: The de-facto image dataset for new algorithms. Is organized according to the WordNet hierarchy, in which each node of the hierarchy is depicted by hundreds and thousands of images.

LSUN: Scene understanding with many ancillary tasks (room layout estimation, saliency prediction, etc.)

MS COCO: Generic image understanding and captioning.

COIL100 : 100 different objects imaged at every angle in a 360 rotation.

Visual Genome: Very detailed visual knowledge base with captioning of ~100K images.

Google’s Open Images: A collection of 9 million URLs to images “that have been annotated with labels spanning over 6,000 categories” under Creative Commons.

Labelled Faces in the Wild: 13,000 labeled images of human faces, for use in developing applications that involve facial recognition.

Stanford Dogs Dataset: Contains 20,580 images and 120 different dog breed categories.

Indoor Scene Recognition: A very specific dataset, useful as most scene recognition models are better ‘outside’. Contains 67 Indoor categories, and a total of 15620 images.

Sentiment Analysis

Multidomain sentiment analysis dataset: A slightly older dataset that features product reviews from Amazon.

IMDB reviews: An older, relatively small dataset for binary sentiment classification, features 25,000 movie reviews.

Stanford Sentiment Treebank: Standard sentiment dataset with sentiment annotations.

Sentiment140: A popular dataset, which uses 160,000 tweets with emoticons pre-removed.

Twitter US Airline Sentiment: Twitter data on US airlines from February 2015, classified as positive, negative, and neutral tweets

Natural Language Processing

Enron Dataset: Email data from the senior management of Enron, organized into folders.

Amazon Reviews: Contains around 35 million reviews from Amazon spanning 18 years. Data include product and user information, ratings, and the plaintext review.

Google Books Ngrams: A collection of words from Google books.

Blogger Corpus: A collection 681,288 blog posts gathered from blogger.com. Each blog contains a minimum of 200 occurrences of commonly used English words.

Wikipedia Links data: The full text of Wikipedia. The dataset contains almost 1.9 billion words from more than 4 million articles. You can search by word, phrase or part of a paragraph itself.

Gutenberg eBooks List: Annotated list of ebooks from Project Gutenberg.

Hansards text chunks of Canadian Parliament: 1.3 million pairs of texts from the records of the 36th Canadian Parliament.

Jeopardy: Archive of more than 200,000 questions from the quiz show Jeopardy.

SMS Spam Collection in English: A dataset that consists of 5,574 English SMS spam messages

Yelp Reviews: An open dataset released by Yelp, contains more than 5 million reviews.

UCI’s Spambase: A large spam email dataset, useful for spam filtering.

Self-driving

Berkeley DeepDrive BDD100k: Currently the largest dataset for self-driving AI. Contains over 100,000 videos of over 1,100-hour driving experiences across different times of the day and weather conditions. The annotated images come from New York and San Francisco areas.

Baidu Apolloscapes: Large dataset that defines 26 different semantic items  such as cars, bicycles, pedestrians, buildings, street lights, etc.

Comma.ai: More than 7 hours of highway driving. Details include car’s speed, acceleration, steering angle, and GPS coordinates.

Oxford’s Robotic Car: Over 100 repetitions of the same route through Oxford, UK, captured over a period of a year. The dataset captures different combinations of weather, traffic and pedestrians, along with long-term changes such as construction and roadworks.

Cityscape Dataset: A large dataset that records urban street scenes in 50 different cities.

CSSAD Dataset: This dataset is useful for perception and navigation of autonomous vehicles. The dataset skews heavily on roads found in the developed world.

KUL Belgium Traffic Sign Dataset: More than 10000+ traffic sign annotations from  thousands of physically distinct traffic signs in the Flanders region in Belgium.

MIT AGE Lab: A sample of the 1,000+ hours of multi-sensor driving datasets collected at AgeLab.

LISA: Laboratory for Intelligent & Safe Automobiles, UC San Diego Datasets: This dataset includes traffic signs, vehicles detection, traffic lights, and trajectory patterns.

If you think we’ve missed a dataset or two, let us know! And check out our more detailed list on datasets for natural language processing.  Still can’t find what you need? Reach out to Gengo — we provide custom machine learning datasets. We manage the entire process, from designing a custom workflow to sourcing qualified workers for your specific project. Plus, our team includes over 21,000+ qualified native speakers in English as well as 36 other languages.

Sources:

https://www.forbes.com/sites/bernardmarr/2018/02/26/big-data-and-ai-30-amazing-and-free-public-data-sources-for-2018/#5406a2285f8a
https://github.com/takeitallsource/awesome-autonomous-vehicles#datasets
https://medium.com/startup-grind/fueling-the-ai-gold-rush-7ae438505bc2
https://www.dataquest.io/blog/free-datasets-for-projects/
https://gengo.ai/articles/the-best-25-datasets-for-natural-language-processing/
https://github.com/awesomedata/awesome-public-datasets#machinelearning

Viewing all 25817 articles
Browse latest View live


<script src="https://jsc.adskeeper.com/r/s/rssing.com.1596347.js" async> </script>