Quantcast
Channel: Hacker News
Viewing all 25817 articles
Browse latest View live

The China ICO Ban

$
0
0

Regulators in China imposed a blanket ban on ICOs over the long weekend.

A number of people have reached out to me via email and Twitter asking me what I think about this.

I think regulation of ICOs is inevitable and a good thing if done right (ie lightly).

The SEC’s comments on ICOs back in July were well done in my view.

There are all sorts of bad things going on in the ICO market right now, from outright scams to projects raising tens of millions of dollars on a white paper written in a day to celebrities getting in on the action.

We needed a cooling off period and if China’s actions are that cooling off period, then I welcome them.

However, a blanket ban on ICOs seems like bad policy to me.

The SEC is heading in the right direction by making a distinction between tokens with real utility vs tokens as a substitute for securities. The former is where the innovation lies. The latter is just a fast and loose way around the rules.

If you look back at the Ethereum token offering several years ago, it is hard to see how that was a bad thing. It provided needed funding to the Ethereum project and the result has been a wave of innovation on top of Ethereum, including the whole concept of ICOs.

If I am reading the Chinese regulators correctly, they are saying that an offering like the one that Ethereum did is not going to be allowed. That’s bad.

Many have speculated that this Chinese ban is temporary to give the Chinese authorities time to come up with sensible regulations. I suspect that is right.

However, I would not like to see the SEC and other regulators follow suit. I think a better move would be to work to rid the market of the scams and other bad actors and actions while allowing for real innovation to continue. That seems to be where the SEC is headed and I encourage them to keep going in that direction and not follow the Chinese.

The US has always been a home to innovation and innovators. We have been able to do that while applying sensible regulations (for the most part) on innovative new technologies. If we continue to take that approach we can compete and even beat China to market in areas like blockchain where they are arguably ahead of us. Naval said it well in this tweet yesterday:


Category 5 Hurricane Irma Brings 180-MPH Winds to Bear on Caribbean Islands

$
0
0

Hurricane Irma's likely path through the Caribbean is shown on this NOAA map from its 2 p.m. ET advisory Tuesday. The blue lines show its potential track, not the outer edge of Irma's strong winds. National Hurricane Centerhide caption

toggle caption
National Hurricane Center

Updated at 2 p.m. ET

"Hurricane Irma has intensified into an extremely dangerous Category 5 hurricane," the National Hurricane Center says, citing the latest data from NOAA and Air Force hurricane hunter aircraft.

With maximum sustained winds of 185 mph, Irma is a Category 5— the most serious type of major hurricane on the Saffir-Sampson wind scale.

Irma is the strongest hurricane the NHC has ever recorded in the Atlantic basin outside of the Caribbean Sea and Gulf of Mexico, the agency says. It intensified at an even faster clip than expected, after its maximum sustained winds were measured at 175 mph early Tuesday morning.

Storm preparations are being rushed to completion in the Leeward Islands, where the first tropical-storm force winds could arrive later Tuesday. Irma is currently forecast to hit the Virgin Islands and Puerto Rico on Wednesday before continuing on toward the Dominican Republic and Cuba.

The storm will bring "life-threatening wind, storm surge, and rainfall," the federal agency says.

As it nears land, Irma is being trailed by another storm — Jose, the 10th tropical storm of the season — which formed in the central Atlantic on Tuesday. Jose is expected to become a hurricane by Thursday morning, and is likely to generate winds that top 100 mph, the hurricane center says.

While it's still too early to say where Irma might have the most impact on the continental United States, the NHC says, "There is an increasing chance of seeing some impacts from Irma in the Florida Peninsula and the Florida Keys later this week and this weekend."

Irma is predicted to maintain winds of at least 145 mph for the next five days.

Long-range forecast models are "in strong agreement on a sharp northward turn on Sunday morning," says Brian McNoldy, a senior research associate at the University of Miami's Rosenstiel School of Marine and Atmospheric Science.

The exact timing of that right-hand turn is still unknown, McNoldy adds — outlining a variable that he says will have "huge implications" for people in Florida. Depending on when it occurs, Irma's turn north could send the storm up either of Florida's coasts, or through its center.

Irma is "potentially catastrophic" and is expected to remain a major hurricane as it makes its way west toward the U.S. mainland's coast, forecasters say. National Hurricane Centerhide caption

toggle caption
National Hurricane Center

"Irma is an extremely impressive hurricane in both infrared and visible satellite images," the National Hurricane Center says, noting its distinct eye that is 25-30 miles wide.

The storm is moving westward at 14 mph, forcing hurricane warnings to be issued for a string of Caribbean islands:

  • U.S. Virgin Islands
  • Puerto Rico, Vieques and Culebra
  • Antigua, Barbuda, Anguilla, Montserrat, St. Kitts and Nevis
  • Saba, St. Eustatius and Sint Maarten
  • Saint Martin and Saint Barthelemy
  • British Virgin Islands

A hurricane watch has been declared in a number of areas, including the Turks and Caicos and the northern coast of Haiti.

Category 5 status means "catastrophic" damage will occur on lands touched by the hurricane, which is currently predicted to remain a major hurricane as it makes its way west toward the U.S. coast.

Jose is predicted to follow the same general path as Irma — but with a slightly more northern approach, in the forecast maps released by the hurricane center Tuesday morning.

Citing the expected effects of Irma, the NHC predicts Jose will build intensity for the next three days before hitting a plateau of around 105 mph on days four and five.

As Irma's track has become more defined, the governors of Florida and Puerto Rico declared preemptive states of emergency.

As NPR's Scott Neuman reported:

" 'We have established protocols for the safety of all,' Puerto Rico Gov. Ricardo Rossello said, urging islanders to take precautions.

"Rossello said 4 to 8 inches of rain were expected, with wind gusts up to 60 mph.

"A few hours later, Florida Gov. Rick Scott issued an executive order declaring a state of emergency in all 67 counties in the state."

Here's how the hurricane center describes the damage that could result from a Category 5 hurricane:

"A high percentage of framed homes will be destroyed, with total roof failure and wall collapse. Fallen trees and power poles will isolate residential areas. Power outages will last for weeks to possibly months. Most of the area will be uninhabitable for weeks or months."

The hurricane hunter aircraft that are helping to measure Irma's growth and likely path include NOAA's Gulfstream IV jet, which took off from Barbados around 1:30 p.m. ET Tuesday to launch dropwindsondes — parachute-equipped sensors that measure temperature, humidity and wind as they fall through storms.

Verizon Up offers rewards in exchange for customers’ personal information

$
0
0

A new Verizon Communications Inc. rewards program, Verizon Up, provides credits that wireless subscribers can use for concert tickets, movie premieres and phone upgrades.

But it comes with a catch: Customers must give the carrier access to their web-browsing history, app usage and location data, which Verizon says it uses to personalize the rewards and deliver targeted advertising as its customers browse the web.

The trade-off...

European court rules companies must tell employees of email checks

$
0
0

STRASBOURG (Reuters) - Companies must tell employees in advance if their work email accounts are being monitored without unduly infringing their privacy, the European Court of Human Rights said in a ruling on Tuesday defining the scope of corporate email snooping.

In a judgment in the case of a man fired 10 years ago for using a work messaging account to communicate with his family, the judges found that Romanian courts failed to protect Bogdan Barbulescu’s private correspondence because his employer had not given him prior notice it was monitoring his communications.

Email privacy has become a hotly contested issue as more people use corporate mobile phones and work addresses for personal correspondence even as employers demand the right to monitor email and computer usage to ensure staff use work email appropriately and to protect their systems.

Courts in general have sided with employers on the issue. The ruling sets boundaries for e-monitoring versus privacy rights, said Stephanie Raets at Belgian law firm Claeys & Engels Antwerp.

“The most important lesson learned from the judgment is that, although an employer may restrict the employees’ privacy in the workplace, it may not reduce it to zero,” she said.

The ruling also showed that employees need to be made well aware of the possible consequences of using email for personal use against company policies, lawyers said.

But they added that the restrictions on the extent to which employers could monitor people’s communications are not really new as they are reflected in existing privacy legislation and have been recognized as good practice by companies in countries like Britain.

The company had presented Barbulescu with printouts of his private messages to his brother and fiancée on Yahoo Messenger as evidence of his breach of a company ban on such personal use.

FILE PHOTO: A generic picture of a woman working in an office sitting at her desk typing on a computer. REUTERS/Catherine Benson CRB

Barbulescu had previously told his employer in writing that he had only used the service for professional purposes.

The European court in Strasbourg ruled by an 11-6 majority that Romanian judges, in backing the employer, had failed to protect Barbulescu’s right to private life and correspondence.

The court concluded that Barbulescu had not been informed in advance of the extent and nature of his employer’s monitoring or the possibility that it might gain access to the contents of his messages. The company was not named in the ruling.

The court also said there had not been a sufficient assessment of whether there were legitimate reasons to monitor Barbulescu’s communications. There was no suggestion he had exposed the company to risks such as damage to its IT systems or liability in the case of illegal activities online.

“This set of requirements will restrict to an important extent the employers’ possibilities to monitor the workers’ electronic communications,” said Esther Lynch, confederal secretary of the European Trade Union Confederation.

“Although it does not generally prohibit such monitoring, it sets high thresholds for its justification. This is a very important step to better protect worker’s privacy.”

The ruling could lead to more clarity on the scope of corporate discipline, said James Froud, partner at law firm Bird & Bird.

“We may see a shift in emphasis, with courts requiring employers to clearly demonstrate the steps they have taken to address the issue of privacy in workplace, both in terms of granting employees ‘space’ to have a private life whilst clearly delineating the boundaries,” he said.

Reporting by Julia Fioretti, Alastair Macdonald and Foo Yun Chee in Brussels; Editing by Matthew Mpoke Bigg

An intermediate-mass black hole candidate in the Milky Way

$
0
0
  • 1.

    Djorgovski, S. G., Volonteri, M., Springel, V., Bromm, V. & Meylan, G. in The Eleventh Marcel Grossmann Meeting on Recent Developments in Theoretical and Experimental General Relativity, Gravitation and Relativistic Field Theories (eds Kleinert, H., Jantzen R. T. & Ruffini, R.) 340–367 (World Scientific, 2008)

  • 2.

    Portegies Zwart, S. F., Makino, J., McMillan, S. L. W. & Hut, P. Star cluster ecology. III. Runaway collisions in young compact star clusters. Astron. Astrophys.348, 117–126 (1999).

  • 3.

    Ebisuzaki, T. et al. Missing link found? The ‘runaway’ path to supermassive black holes. Astrophys. J562, L19–L22 (2001).

  • 4.

    Oka, T., Mizuno, R., Miura, K. & Takekawa, S. Signature of an intermediate-mass black hole in the central molecular zone of our Galaxy. Astrophys. J.816, L7 (2016).

  • 5.

    Oka, T. et al. ASTE CO J = 3–2 survey of the Galactic Center. Astrophys. J. Suppl.201, 14–25 (2012).

  • 6.

    Oka, T., Hasegawa, T., Sato, F., Tsuboi, M. & Miyazaki, A. A large-scale CO survey of the Galactic Center. Astrophys. J. Suppl.118, 455–515 (1998).

  • 7.

    Oka, T. et al. A high-velocity molecular cloud near the center of the Galaxy. Astrophys. J.515, 249–255 (1999).

  • 8.

    Oka, T., Hasegawa, T., Sato, F., Tsuboi, M. & Miyazaki, A. A hyperenergetic CO shell in the Galactic Center molecular cloud complex. Publ. Astron. Soc. Japan53, 787–791 (2001).

  • 9.

    Maillard, J. P., Paumard, T., Stolovy, S. R. & Rigaut, F. The nature of the Galactic Center source IRS 13 revealed by high spatial resolution in the infrared. Astron. Astrophys.423, 155–167 (2004).

  • 10.

    Schödel, R., Eckart, A., Iserlohe, C., Genzel, R. & Ott, T. Black hole in the Galactic Center complex IRS 13E ? Astrophys. J.625, L111–L114 (2005).

  • 11.

    Gillessen, S. et al. Monitoring stellar orbits around the massive black hole in the Galactic Center. Astrophys. J.692, 1075–1109 (2009).

  • 12.

    Pierce-Price, D. et al. A deep submillimeter survey of the Galactic Center. Astrophys. J545, L121–L125 (2000).

  • 13.

    Hatsukade, B. et al. AzTEC/ASTE 1.1-mm survey of the AKARI Deep Field South: source catalogue and number counts. Mon. Not. R. Astron. Soc411, 102–116 (2011).

  • 14.

    Rybicki G. B., & Lightman A. P. Radiative Processes in Astrophysics (Wiley-VCH, Weinheim, Germany, 1986).

  • 15.

    Djorgovski, S. & King, I. R. Surface photometry in cores of globular clusters. Astrophys. J.277, L49–L52 (1984).

  • 16.

    McLaughlin, D. E. Binding energy and the fundamental plane of globular clusters. Astrophys. J.539, 618–640 (2000).

  • 17.

    Marchant, A. B. & Shapiro, S. L. Star clusters containing massive, central black holes. III. Evolution calculations. Astrophys. J.239, 685–704 (1980).

  • 18.

    Marconi, A. & Hunt, L. K. The relation between black hole mass, bulge mass, and near-infrared luminosity. Astrophys. J.589, L21–L24 (2003).

  • 19.

    Moran, E. C. et al. Black holes in the centers of nearby dwarf galaxies. Astron. J.148, 136–157 (2014).

  • 20.

    van Loon, J. T. et al. Infrared stellar populations in the central parts of the Milky Way galaxy. Astron. Astrophys.338, 857–879 (2003).

  • 21.

    Sashida, T. et al. Kinematics of shocked molecular gas adjacent to the supernova remnant W44. Astrophys. J.774, 10–16 (2013).

  • 22.

    Yamada, M. et al. Kinematics of ultra-high-velocity gas in the expanding molecular shell adjacent to the W44 supernova remnant. Astrophys. J.834, L3 (2017).

  • 23.

    Takekawa, S., Oka, T., Iwata, Y., Tokuyama, S. & Nomura, M. Discovery of two small high-velocity compact clouds in the central 10 parsecs of the Galaxy. Astrophys. J. 843, L11 (2017). 

  • 24.

    Agol, E., Kamionkowski, M., Koopmans, Léon, V. E., Blandford & Roger, D. Finding black holes with microlensing. Astrophys. J576, L131–L135 (2002).

  • 25.

    Corral-Santana, J. M. et al. BlackCAT: a catalogue of stellar-mass black holes in X-ray transients. Astron. Astrophys.587, A61 (2016).

  • New lubricated mussel-proof coating

    $
    0
    0

    If you are on a personal connection, like at home, you can run an anti-virus scan on your device to make sure it is not infected with malware.

    If you are at an office or shared network, you can ask the network administrator to run a scan across the network looking for misconfigured or infected devices.

    Tendermint 0.10.2

    $
    0
    0

    Tendermint is a server and a protocol for building linearizable (or sequentially consistent) byzantine fault-tolerant applications. Tendermint validators accept transactions from clients over HTTP, and replicate them to the other validators in the cluster, forming a totally ordered sequence of transactions. Each transaction is verified by a cryptographic signature over the previous transaction, forming a blockchain. As long as more than 2/3 of the cluster is online, connected to each other, and non-malicious, progress and linearizability of transactions is guaranteed. In the presence of byzantine validators which control 1/3 or more of the voting power, safety is no longer guaranteed: the cluster may exhibit split brain behavior, discard committed transactions, etc.

    Transactions are first broadcast, via a gossip protocol, to every node. A proposer, chosen by a deterministic round-robin algorithm, bundles up pending transactions into a block, and proposes that block to the cluster. Nodes then pre-vote on whether they consider the block acceptable, and broadcast their decision. Once a 2/3 majority pre-vote yes, nodes pre-commit the block, and broadcast their intention to commit. Once 2/3 of the cluster has pre-committed a block, the block can be considered committed, and the initiating node can learn the transaction is complete. Tendermint therefore requires four network hops to complete a transaction, given a totally-connected non-faulty component of the cluster holding more than 2/3 of the total votes.

    Proposers create and propose new blocks roughly once a second, though this behavior is configurable. This adds about 500 ms of latency to any given transaction. However, because a block encompasses multiple transactions, transaction throughput is not limited by this latency, so long as transactions can commit regardless of order. Where one transaction depends on another—for instance, when multiple actors concurrently update a record using a [read, compare-and-set] cycle, throughput is inversely proportional to network latency plus proposer block delay.

    Like Bitcoin and Ethereum, Tendermint is a blockchain system. However, where Bitcoin defines a currency, and Ethereum defines a virtual machine for computation, Tendermint deals in opaque transactional payloads. As in Raft, the semantics of those transactions are defined by a pluggable state machine, which talks to Tendermint using a protocol called the ABCI, or Application BlockChain Interface. There are therefore two distinct programs running on a typical Tendermint node: the Tendermint validator, and the state machine application. The two communicate via ABCI over a socket.

    There are several ABCI applications for use with Tendermint, including Ethermint, an implementation of Ethereum; Basecoin, an extensible proof-of-stake cryptocurrency, and Merkleeyes, a key-value store supporting linearizable reads, writes, and compare-and-set operations, plus a weaker, sequentially consistent read of any node’s local state. In these tests, we’ll use Merkleeyes to evaluate the combined safety properties of Tendermint and Merkleeyes together; we have not evaluated Ethermint or Basecoin.

    We model Merkleeyes as a linearizable key-value store supporting single-key reads, writes, and compare-and-set operations, and use the Jepsen testing library to check whether these operations are safe. Jepsen submits transactions via Tendermint’s HTTP interface, using /broadcast_tx_commit to block until the transaction can be confirmed or rejected. Jepsen then verifies whether the history of transactions was linearizable, once the test is complete.

    We introduced three modifications to Merkleyes to support this test. Originally, users queried Merkleeyes by performing a local read on any node, instead of going through consensus. This allowed stale reads, so the Tendermint team added support for read transactions, which should be fully linearizable.

    In addition, one cannot execute the same transaction more than once in Tendermint: two transactions with the same byte representation—say, “write meow to key cat”—are considered to be the same transaction. Tendermint’s maintainers added a 12-byte random nonce field to the start of Merkleeyes transactions, which lets us perform the same operation more than once.

    Early experiments also led to crashes and storage corruption in Merkleeyes, which the Tendermint team traced to a race condition in check_tx, where rapid mutation of the on-disk tree representing the current data store could lead to premature garbage collection of a tree node which was still in use by the most recent version of the tree. While a full fix was not available during our tests, Tendermint provided Jepsen with a Merkleeyes build patched to work around the issue.

    Compare-and-set Registers

    We designed two tests for Tendermint. The first, cas-register, performs a randomized mix of reads, writes, and compare-and-set operations against a small pool of keys, rotating through keys over time. We verify the correctness of these operations using the Knossos linearizability checker. To improve per-operation latency at the cost of throughput, we lower or altogether skip the commit timeout, putting transactions through consensus immediately instead of waiting to batch them together.

    Unlike many quorum or leader-based distributed systems, Tendermint nodes have no notion of “the system is down”, and will never reject a transaction for want of available replicas. This is partly a consequence of its leaderless design: nodes have no way to recognize that they are, for instance, followers who cannot execute a transaction. This also stems from Tendermint’s aggressive use of asynchronous gossip for state exchange: even if a node cannot directly replicate a transaction to a 2/3 majority of peers, it may be able to reach one peer who can re-broadcast the transaction to a majority eventually.

    This makes verifying Tendermint somewhat difficult: when the network is partitioned, in-flight requests will hang for a significant amount of time—potentially the duration of the partition. Moreover, these indefinite latencies persist so long as the system is degraded, instead of being a transient phenomenon. Jepsen needs to keep performing requests, so after a timeout, we declare those operations indeterminate and perform new ones. Whether we perform timeouts or not, this introduces large windows of concurrency for transactions, which has two consequences: first, it increases the state space for the linearizability checker, leading to slow and potentially impossible-to-analyze histories, and second, it increases the number of legal states at any given point, which prevents us from catching anomalies—cases where the system reached an illegal state.

    To address the performance problem, we added a new algorithm to Knossos, based on Lowe, Horn and Kroening’s refinement of Wing & Gong’s algorithm for verifying linearizability. Following Lowe’s approach, we apply both Lowe’s just-in-time graph search (already a part of Knossos) and Wing & Gong’s backtracking search in parallel, and use whichever strategy terminates first. This led to dramatic speedups—two orders of magnitude—in verifying Tendermint histories.

    However, the indeterminacy problem is not a performance issue, but rather an inherent consequence of our test design. To keep state spaces small, Jepsen linearizability tests typically use reads, writes, and compare-and-set over a small space of values: for instance, the integers {1, 2, 3, 4, 5}. We detect nonlinearizable histories by observing an impossible operation, like “read 3” when the set of legal values, at that point in the history, was only {1, 2}. When there are many concurrent writes, we saturate the state space: more and more values are legal, and fewer and fewer reads are illegal. It becomes harder and harder to detect errors as the test goes on and more operations time out.

    We need a complementary approach.

    Sets

    In addition to the cas-register test, we have a second test which uses a single key in Merkleeyes to store a set of values. Each client tries to add a unique number i to this set, by reading the current set S, and performing a compare-and-set from S → (S ∪ {i}). At the end of the test, we read the current key from Merkleeyes and identify which numbers were preserved.

    If the system is linearizable, every prior add operation should be present in the read set; we can verify this in O(n) time, instead of solving the NP-hard problem of generalized linearizability verification. Moreover, crashed operations have no effect on the safety of other, concurrent operations; we don’t have to worry about the state space saturation problem that limits the linearizable register test. On the other hand, we cannot detect transient errors during the test; the system is free, for instance, to be sequentially or even eventually consistent, so long as all successful adds appear in time for the final read(s).

    While running these test workloads, we introduce a number of faults into the cluster, ranging from clock skews, crashes, and partitions, to byzantine faults like duplicate validators with partitions, write-ahead-log truncation, and dynamic reconfiguration of cluster membership.

    Clocks

    Tendermint uses timeouts to trigger fault detection and new block proposals. We interfere with those timeouts through a randomized mixture of long-lasting clock offsets and high-frequency clock strobing, intended to create both subtle and large difference between node clocks, and to trigger single-node timeouts earlier than intended. While clock skew can induce delays and timeouts in Tendermint, it does not appear to affect safety: we have yet to observe a nonlinearizable outcome in either register or set tests.

    Crash Safety

    We evaluate crash-safety by killing Tendermint and Merkleeyes on every node concurrently, then restarting them, every 15 seconds. Connections drop and in-flight transactions will time out, but once restarted, it only takes 5–10 seconds to restore normal operation.

    Latency of Tendermint transactions through total-cluster crash and restarts
    Latency of Tendermint transactions through total-cluster crash and restarts

    In this plot of a set test’s latencies, shaded regions indicate the window where nodes were crashed. Note that latencies spike to 2–10 seconds initially, then converge on 500-1000 ms once the cluster recovers. Low-latency failures are connection-refused errors. info operations are indeterminate; they may have either succeeded or failed.

    Network Partitions

    We evaluated Tendermint safety with several classes of network partitions. We isolate individual nodes; split the cluster cleanly in half; or construct overlapping-ring topologies, where nodes are arranged in a ring, and each node is connected to its nearest neighbors, such that every node can see a majority of the cluster, but no two nodes agree on what that majority is. Although we can induce latency spikes with single-node partitions, and long-lasting downtime by splitting the cluster in half or with majority rings, no network partition resulted in nonlinearizable histories.

    Byzantine Validators

    Verifying byzantine safety is, in general, difficult: one must show that malicious validators are unable to compromise safety, which requires that we know (and implement) appropriately pernicious strategies. For time reasons, we have not built our own byzantine Tendermint validators. However, we can test some measure of byzantine fault tolerance by running multiple copies of legal validators with the same validator key, and feeding them different operations. These duplicate validators will fight over which history of blocks they prefer—using their signing key to vote twice for different alternatives, and, hopefully, exposing safety issues.

    Unfortunately, these types of byzantine validators do not seem capable of causing nonlinearizable histories—so long as we constrain byzantine validator keys to own less than 1/3 of the total votes. If they own more than 1/3 of the votes, then it is theoretically possible to observe nonlinearizable histories.

    For instance, consider a four node cluster: two nodes A and Aʹ with the same validator key, and non-byzantine nodes B and C. Let the key shared by A and Aʹ have 7 votes, and B and C have 2 votes each. The total number of votes in the cluster is therefore 11, and any group of nodes with at least 8 votes controls a 2/3 majority and can commit new blocks. Without loss of generality, if A proposes transaction T and B votes for it, then [A, B] has 9 votes and can legally commit. At the same time, [Aʹ, C]also has 9 votes and can commit a totally independent block, leading to inconsistency.

    However, this anomaly is difficult to observe: when a Tendermint node encounters two conflicting blocks which were both signed off on by the same key, that node crashes, and a majority of the cluster quickly comes to a halt.

    Clusters with these “super-byzantine” validators tend to kill themselves before we can observe safety violations. We need a more sophisticated approach.

    panic: Panicked on a Consensus Failure: +2/3 committed an invalid block:
    Wrong Block.Header.LastBlockID.  Expected
    25D18C27F8E1DC2C0F858D80DDBBE272E1DA9E27:1:567B03A9A6FC, got
    EE5BD42D329C8925123AF994FDF25E2D1053D2C8:1:A3D3511E2531

    Byzantine Validators with Partitions

    To observe divergence, we need to keep both components of the network independent from one another long enough for both to commit—for instance, through a particular type of network partition. We use two in the Tendermint Jepsen tests. The first picks one of the duplicate validators to participate in the current cluster, and isolates the others completely, unable to make progress. As duplicate validators swap in and out of the majority component, we simulate a single validator which is willing to go back on its claims—voting differently for the same blocks. This technique can result in nonlinearizable histories, but only when duplicate validator keys control more than 1/3 of the vote.

    A second, more robust partition splits the cluster evenly, such that each duplicate validator is in contact with roughly half of the non-byzantine nodes. This approach yields safety violations more reliably, since both components have sufficient votes to perform consensus independently. For instance, in this run, several concurrent set tests report the loss of a handful of transactions:

    {:valid? false,
     :lost "#{96 110 119..120 122 126}",
     :recovered "#{}",
     :ok "#{0 3 5 ... 123 125 128}",
     :recovered-frac 0,
     :unexpected-frac 0,
     :unexpected "#{}",
     :lost-frac 2/43,
     :ok-frac 53/129}

    However, so long as byzantine validators control less than 1/3 of the vote, Tendermint appears to satisfy its safety claims: histories are linearizable and we do not observe the loss of committed transactions.

    File Truncation

    To make the crash-recovery scenario somewhat more aggressive, we introduce a byzantine variant, where write-ahead-logs are truncated during a crash. This simulates the effects of filesystem corruption. We kill Tendermint and Merkleeyes on up to 1/3 of the validators, chop a few random bytes off the Merkleeyes LevelDB logs on those nodes, then restart. Because Tendermint is byzantine fault-tolerant, we should be able to arbitrarily corrupt logs on up to 1/3 of the cluster without problems.

    This scenario does not appear to lead to the loss of acknowledged operations, but it can cause Merkleeyes to panic on startup, as the LevelDB recovery process is unable to handle logfile truncation under certain circumstances. If more than 1/3 of the validators experience this type of fault, it could render the cluster unusable until a suitable program can be written to process the LevelDB log files.

    We believe this is due to one or more bugs in goleveldb’s recovery code; there have been reports of similar panics in goleveldb from Prometheus and Syncthing, and consequent bugfixes which may address the issue in Tendermint as well. The Tendermint team plans to update goleveldb and see if this addresses the problem.

    In addition to Merkleeyes, Tendermint’s consensus system has its own write-ahead log. Unlike Merkleeyes, truncated entries in the Tendermint WAL are silently ignored, and preceding entries are correctly recovered instead of panicking the server.

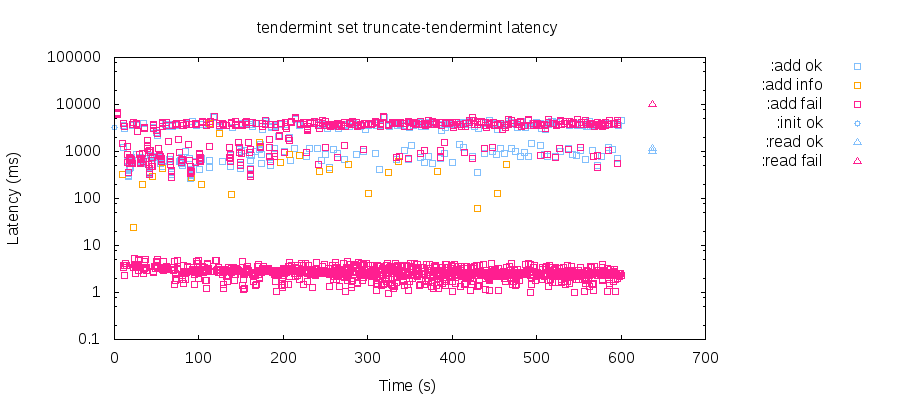
    Because 2/3 of the cluster remains online in our scenario, Tendermint can continue processing transactions throughout the test. However, there is a distinct impact any time a node crashes: that node closes connections and refuses new ones, which results in a stream of low-latency failures in the latency distribution. We also see elevated latencies—on the order of three to four seconds—due to the repeated failure of a single node. Because nodes take turns proposing new blocks in Tendermint, the failure of any single node disrupts the commit process for 1 : n blocks—the remaining nodes must wait for timeout_propose (which defaults to three seconds) until a healthy node can retry the proposal. These elevated latencies persist until the down node recovers, or until it is ejected from the validator set, e.g. by an operator. Note that this is different than a leader-based system like Raft, where the loss of a leader causes every transaction to time out or fail, but once a new leader is elected, latencies return to normal.

    Set test latencies through repeated crashes, truncations, and restarts of Tendermint nodes.
    Set test latencies through repeated crashes, truncations, and restarts of Tendermint nodes.

    So long as truncation affects less than 1/3 of the cluster, Tendermint appears safe; we have not identified any linearizability violations due to WAL truncation. However, there is a more subtle problem lurking in the Tendermint WAL: it doesn’t fsync operations to disk. When transactions are written to the log, Tendermint calls write (2) before returning, but fails to fsync. This implies that operations acknowledged as durable may be lost if, say, the power fails. Tendermint closes and reopens files regularly, but close (2) doesn’t fsync either. Due to time constraints, we have not experimentally reproduced this behavior, but it seems likely that a simultaneous power failure affecting more than 1/3 of the cluster could cause the loss of committed transactions. Tendermint is working to ensure data is synced to disk before considering it durable.

    Dynamic Reconfiguration

    Tendermint supports dynamic cluster membership: a special transaction type allows operators to reweight validator votes, add new validators, or remove existing validators, at runtime. In addition, we can start and stop instances of validators on physical nodes, creating cases where validators are running nowhere, move from node to node, or run on n nodes concurrently: a byzantine case.

    We designed a state machine for modeling cluster state, generating randomized transitions, ensuring those transitions result in legal cluster states, and applying those transitions to the cluster. We ensure that 2/3 of the cluster’s voting power remains online, that less than 1/3 of the cluster is down or byzantine, that no more than 2 nodes run validators which are not a part of the cluster config, and that no more than 2 validators in the config are offline at any time.

    These rules keep the cluster in a continuously healthy state, which is important because changing the validator set requires that Tendermint is still capable of committing transactions—if we prevent Tendermint from making progress, we won’t be able to continue the test, or, for that matter, change the membership to fix things. Similar constraints prevent us from testing network partitions combined with reconfiguration, at least in general: a partition might prevent the cluster from repairing faulty replicas between transitions, leading to safe states which are, in actuality, unsafe.

    With these caveats, we found no evidence of safety violations through hundreds of cluster transitions. Tendermint appears to preserve linearizability, so long as the aforementioned constraints are satisfied.

    We uncovered three durability issues in our research. The first is a crash in Merkleeyes, the example key-value store, where the on-disk store could become corrupt due to repeated updates on a single key. The second is a bug in goleveldb, which causes Merkleeyes to crash when recovering from a truncated logfile. The third is a problem with the Tendermint WAL, which is not synced to disk before operations are acknowledged to clients. If more than 1/3 of the cluster experiences, say, power failure, it might allow the loss of acknowledged operations. All three of these issues are confirmed by the Tendermint team, and patches are under development.

    Otherwise, Tendermint appears to satisfy its safety guarantees: transactions appear linearizable in the presence of simple and complex network partitions, clock skew, and synchronized crash-restart cycles. In addition, Tendermint appears to tolerate byzantine faults on less than 1/3 of the cluster, including duplicated validators with or without partitions, dynamic membership changes, and file truncation.

    As an experimental validation technique, Jepsen cannot prove correctness; only the existence of bugs. Our experiments are limited by throughput, cluster recovery time, and operation latency; as Tendermint matures and performance improves, we might be able to detect faults more robustly. It is also possible that composite failure modes—for instance, changing the nodes in a validator set during a particular network partition—might prove fruitful, but we have not explored those here.

    We have also not formally proved the cryptographic or safety properties of Tendermint’s core algorithm, nor have we model-checked its correctness. Future research could engage formal methods to look for pathological message orders which might lead to safety violations, or cryptographic attacks against the Tendermint consensus algorithm.

    This research was funded by the Tendermint team, and conducted in accordance with the Jepsen ethics policy. We would like to thank Tendermint for their assistance in designing these tests, and for developing new Tendermint features to support Jepsen testing.

    What the Industrial Revolution Tells Us about the Future of Automation

    $
    0
    0

    As automation and artificial intelligence technologies improve, many people worry about the future of work. If millions of human workers no longer have jobs, the worriers ask, what will people do, how will they provide for themselves and their families, and what changes might occur (or be needed) in order for society to adjust?

    Many economists say there is no need to worry. They point to how past major transformations in work tasks and labor markets – specifically the Industrial Revolution during the 18th and 19th centuries – did not lead to major social upheaval or widespread suffering. These economists say that when technology destroys jobs, people find other jobs. As one economist argued:

    "Since the dawn of the industrial age, a recurrent fear has been that technological change will spawn mass unemployment. Neoclassical economists predicted that this would not happen, because people would find other jobs, albeit possibly after a long period of painful adjustment. By and large, that prediction has proven to be correct."

    They are definitely right about the long period of painful adjustment! The aftermath of the Industrial Revolution involved two majorCommunist revolutions, whose death toll approaches 100 million. The stabilizing influence of the modern social welfare state emerged only after World War II, nearly 200 years on from the 18th-century beginnings of the Industrial Revolution.

    Today, as globalization and automation dramatically boost corporate productivity, many workers have seen their wages stagnate. The increasing power of automation and artificial intelligence technology means more pain may follow. Are these economists minimizing the historical record when projecting the future, essentially telling us not to worry because in a century or two things will get better?

    Upheaval more than a century into the Industrial Revolution, and more than 100 years ago:
    An International Workers of the World union demonstration
    in New York City in 1914. Credit: Library of Congress

    Reaching a tipping point

    To learn from the Industrial Revolution, we must put it in the proper historical context. The Industrial Revolution was a tipping point. For many thousands of years before it, economic growth was practically negligible, generally tracking with population growth: Farmers grew a bit more food and blacksmiths made a few more tools, but people from the early agrarian societies of Mesopotamia, Egypt, China and India would have recognized the world of 17th-century Europe.

    But when steam power and industrial machinery came along in the 18th century, economic activity took off. The growth that happened in just a couple hundred years was on a vastly different scale than anything that had happened before. We may be at a similar tipping point now, referred to by some as the "Fourth Industrial Revolution," where all that has happened in the past may appear minor compared to the productivity and profitability potential of the future.

    Getting predictions wrong

    It is easy to underestimate in advance the impact of globalization and automation – I have done it myself. In March 2000, the NASDAQ Composite Index peaked and then crashed, wiping out US$8 trillion in market valuations over the next two years. At the same time, the global spread of the internet enabled offshore outsourcing of software production, leading to fears of information technology jobsdisappearing en masse.

    The Association for Computing Machinery worried what these factors might mean for computer education and employment in the future. Its study group, which I co-chaired, reported in 2006 that there was no real reason to believe that computer industry jobs were migrating away from developed countries. The last decade has vindicated that conclusion.

    Our report conceded, however, that "trade gains may be distributed differentially," meaning some individuals and regions would gain and others would lose. And it was focused narrowly on the information technology industry. Had we looked at the broader impact of globalization and automation on the economy, we might have seen the much bigger changes that even then were taking hold.

    Spreading to manufacturing

    In both the first Industrial Revolution and today's, the first effects were in manufacturing in the developed world. By substituting technology for workers, U.S. manufacturing productivity roughly doubled between 1995 and 2015. As a result, while U.S. manufacturing output today is essentially at an all-time high, employment peaked around 1980, and has been declining precipitously since 1995.

    Unlike in the 19th century, though, the effects of globalization and automation are spreading across the developing world. Economist Branko Milanovic's "Elephant Curve" shows how people around the globe, ranked by their income in 1998, saw their incomes increase by 2008. While the income of the very poor was stagnant, rising incomes in emerging economies lifted hundreds of millions of people out of poverty. People at the very top of the income scale also benefited from globalization and automation.

    But the income of working- and middle-class people in the developed world has stagnated. In the U.S., for example, income of production workers today, adjusted for inflation, is essentially at the level it was around 1970.

    Now automation is also coming to developing-world economies. A recent report from the International Labor Organization found that more than two-thirds of Southeast Asia's 9.2 million textile and footwear jobs are threatened by automation.

    Waking up to the problems

    In addition to spreading across the world, automation and artificial intelligence are beginning to pervade entire economies. Accountants, lawyers, truckers and even construction workers– whose jobs were largely unchanged by the first Industrial Revolution – are about to find their work changing substantially, if not entirely taken over by computers.

    Until very recently, the global educated professional class didn't recognize what was happening to working- and middle-class people in developed countries. But now it is about to happen to them.

    The results will be startling, disruptive and potentially long-lasting. Political developments of the past year make it clear that the issue of shared prosperity cannot be ignored. It is now evident that the Brexit vote in the U.K. and the election of President Donald Trump in the U.S. were driven to a major extent by economic grievances.

    Our current economy and society will transform in significant ways, with no simple fixes or adaptations to lessen their effects. But when trying to make economic predictions based on the past, it is worth remembering – and exercising – the caution provided by the distinguished Israeli economist Ariel Rubinstein in his 2012 book, "Economic Fables":

    "I am obsessively occupied with denying any interpretation contending that economic models produce conclusions of real value."

    Rubinstein's basic assertion, which is that economic theory tells us more about economic models than it tells us about economic reality, is a warning: We should listen not only to economists when it comes to predicting the future of work; we should listen also to historians, who often bring a deeper historical perspective to their predictions. Automation will significantly change many people's lives in ways that may be painful and enduring.

    Author: Moshe Y. Vardi,  professor of Computer Science, Rice University

    I enjoyed the article, especially reading it the day after Labor Day, however it would be stronger if it called for owning the means of production. What is stopping accountants, lawyers, truckers, construction workers from forming new unions or using their existing unions as leverage to buy and own the new means of production? That is a question worth exploring because it would reduce the harmful effects of automation.

    I would highly recommend The Origins of Capitalism and Platform Capitalism to understand the past and to understand our future where the Big Tech companies own the means of production through AI and automation.


    Solaris to Linux Migration 2017

    $
    0
    0

    Many people have contacted me recently about switching from Solaris (or illumos) to Linux, especially since most of the Solaris kernel team were let go this year (including my former colleagues, I'm sorry to hear). This includes many great engineers who I'm sure will excel in whatever they choose to work on next. They have been asking me about Linux because I've worked for years on each platform: Solaris, illumos, and Linux, in all cases full time and as a subject matter expert. I've also done some work on BSD, which is another compelling choice, but I'll discuss that another time. The following is my opinion and not an official guide to any OS.

    Switching from Solaris to Linux has become much easier in the last two years, with Linux developments in ZFS, Zones, and DTrace. I've been contributing (out of necessity), including porting my DTraceToolkit tools to Linux, which also work on BSD. What follows are topics that may be of interest to anyone looking to migrate their systems and skillset: scan these to find topics that interest you.

    ZFS

    ZFS is available for Linux via the zfsonlinux and OpenZFS projects, and more recently was included in Canonical's Ubuntu Linux distribution: Ubuntu Xenial 16.04 LTS (April 2016). It uses a Solaris Porting Layer (SPL) to provide a Solaris-kernel interface on Linux, so that unmodified ZFS code can execute.

    My company uses ZFS on Linux in production, and I've been the go-to person for deep ZFS problems. It feels largely the same, except kstats are in /proc/spl/kstat/zfs/arcstats, and I debug it with Linux tracing tools instead of DTrace (more on that next). There have been some issues on Linux, but overall it's been ok, especially given how hard we push ZFS. We've used it for our container hosts (codename Titus) that do frequent snapshots, use send/recv, etc.

    I think the ARC memory counters need more work, as people keep capping the ARC to avoid keeping memory from applications, and the ARC should already handle that (with the exception of massive allocations). There's also a ZFS send/recv code path that should try to use the TASK_INTERRUPTIBLE flag (as suggested by a coworker), to avoid a kernel hang (can't kill -9 the process). Both of those should be easy fixes. There are plenty of other bugs to fix, though, which you can see in the issue list on github.

    Linux has also been developing its own ZFS-like filesystem, btrfs. Since it's been developed in the open (unlike early ZFS), people tried earlier ("IS EXPERIMENTAL") versions that had serious issues, which gave it something of a bad reputation. It's much better nowadays, and has been integrated in the Linux kernel tree (fs/btrfs), where it is maintained and improved along with the kernel code. Since ZFS is an add-on developed out-of-tree, it will always be harder to get the same level of attention.

    We're now testing container hosts in production on btrfs, instead of ZFS. Facebook have been using btrfs for a while in production, and key btrfs developers now work at Facebook and continue its development. There is a btrfs status page, but for the latest in development see btrfs posts to the linux kernel mailing list and btrfs sections on kernelnewbies. It's a bit early for me to say which is better nowadays on Linux, ZFS or btrfs, but my company is certainly learning the answer by running the same production workload on both. I suspect we'll share findings in a later blog post.

    Observability

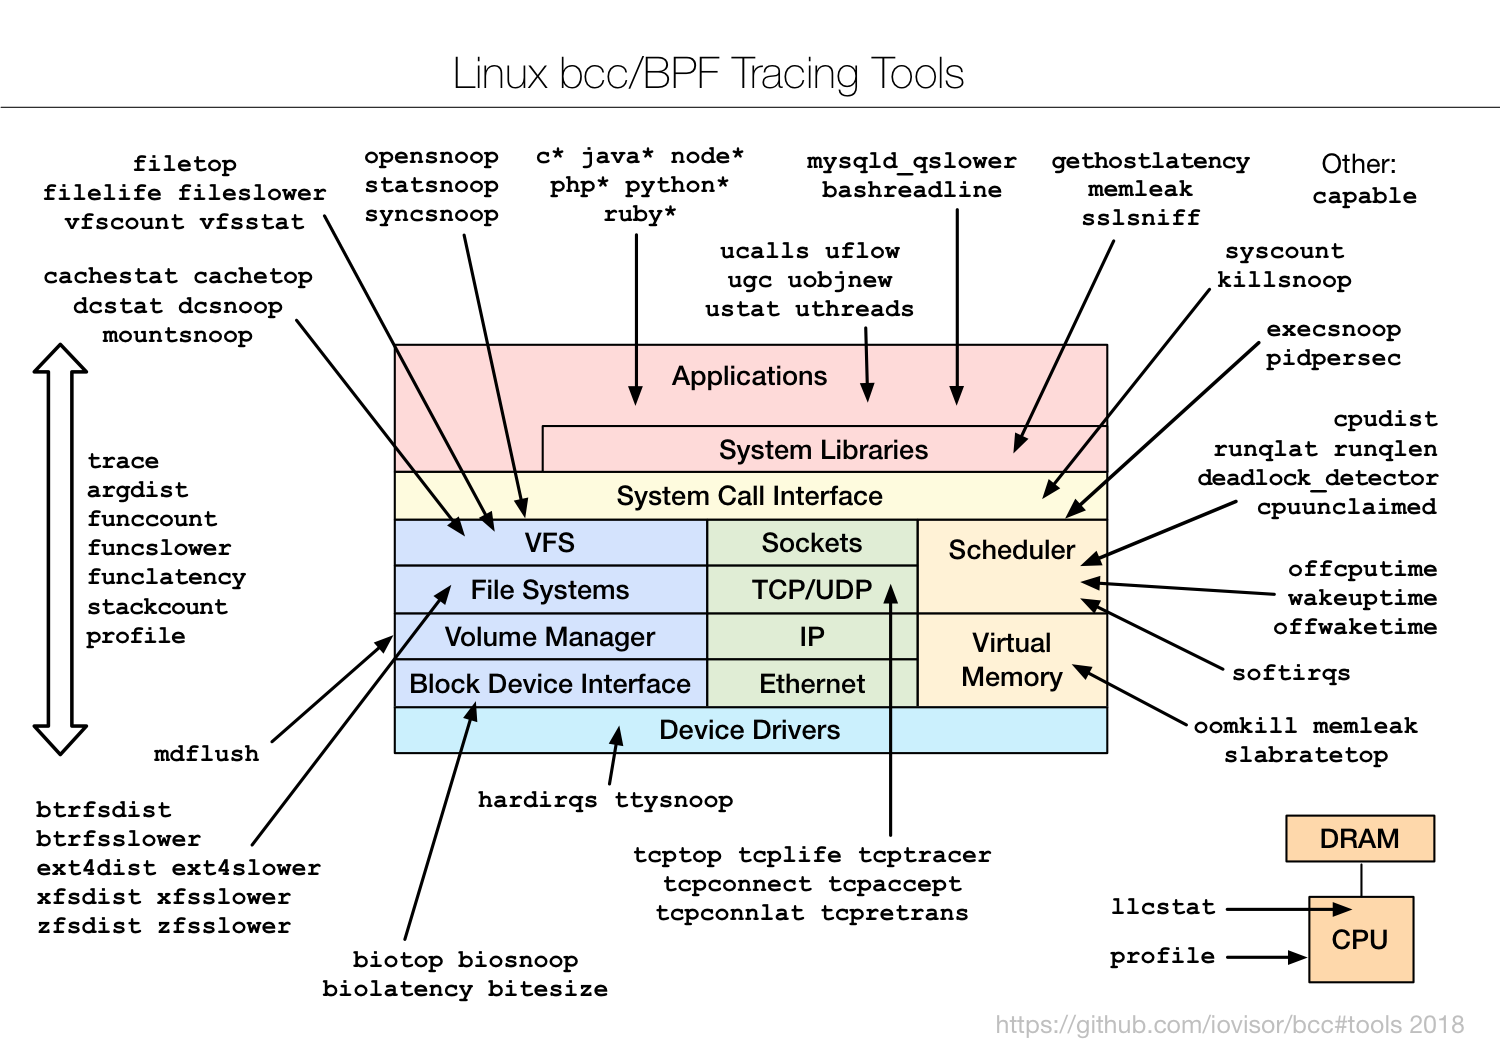
    Here's the big picture of performance observability tools on Linux, from my Linux performance page, where I also have diagrams for other tool types, as well as videos and slides of prior Linux performance talks:

    I also have a USE Method: Linux Performance Checklist, as a different way to navigate and apply the tools.

    Linux has many more text interfaces in /proc that Solaris does, which help for ad hoc debugging. It sounds inefficient, but I've never seen /proc readers show up in CPU flame graphs.

    DTrace

    Linux 4.9 provides the raw capabilities to implement DTrace-like scripts, allowing me to port over many of my DTraceToolkit scripts (they also work on BSD). The hardest part on Linux is now done: kernel support. I wrote about it in a previous post, DTrace for Linux 2016. You might also like my Give me 15 minutes and I'll change your view of Linux tracing video as an introduction to the different built-in Linux tracers.

    Nowadays, there are three built-in tracers that you should know about:

    • ftrace: since 2008, this serves many tracing needs, and has been enhanced recently with hist triggers for custom histograms. It's fast, but limited in places, and usually only suited as a single-user tool (there are workarounds). I wrote an ftrace toolkit, perf-tools, and the article Ftrace: the hidden light switch.
    • perf: since 2009, this started as a PMC profiler but can do tracing now as well, usually in a dump-and-post-process style. It's the official profiler. I wrote a page on it: perf.
    • eBPF: tracing features completed in 2016, this provides efficient programmatic tracing to existing kernel frameworks. Many new tools can now be written, and the main toolkit we're working on is bcc.

    Here's some output from my zfsdist tool, in bcc/BPF, which measures ZFS latency as a histogram on Linux:

    # zfsdist
    Tracing ZFS operation latency... Hit Ctrl-C to end.
    ^C
    
    operation = 'read'
         usecs               : count     distribution
             0 -> 1          : 0        |                                        |
             2 -> 3          : 0        |                                        |
             4 -> 7          : 4479     |****************************************|
             8 -> 15         : 1028     |*********                               |
            16 -> 31         : 14       |                                        |
            32 -> 63         : 1        |                                        |
    [...]

    Linux has been adding tracing technologies over the years: kprobes (kernel dynamic tracing), uprobes (user-level dynamic tracing), tracepoints (static tracing), and perf_events (profiling and hardware counters). The final piece was enhanced BPF (aka eBPF: enhanced Berkeley Packet Filter), which provided the custom in-kernel programmability needed for an advanced tracer, created by Alexei Starovoitov (now at Facebook).

    There's a front-end for BPF, bcc (BPF Compiler Collection), which has many single- and multi-purpose tools written by me and others. Check it out. It's currently much more difficult to write a bcc/BPF script than a DTrace script, but at least it's now possible (using Linux built-ins), and one day there might be an easier front-end.

    I have a page on eBPF tracing, and the current bcc/BPF tools are:

    There have been other tracing projects for Linux, and some companies found them useful for their needs, but the big problem was that they weren't merged in mainline Linux. Now that eBPF has been, many of these tracing projects may switch to using it as a backend since it is stable, or, they could further specialize in what they do (non-BPF related), eg, offline analysis of a capture file (LTTng, sysdig).

    If you're on an older Linux kernel (3.x), you can use ftrace for some tracing needs. My perf-tools includes single purpose tools like opensnoop, execsnoop, iosnoop, and more, and multi-purpose tools like funccount, kprobe, and uprobe. I intended perf-tools as a hacky workaround until eBPF was available, but ftrace has since been developed further (hist triggers) so perf-tools may have a reason to continue.

    Zones

    I'd recommend this post about Zones vs Containers by Jessie Frazelle.

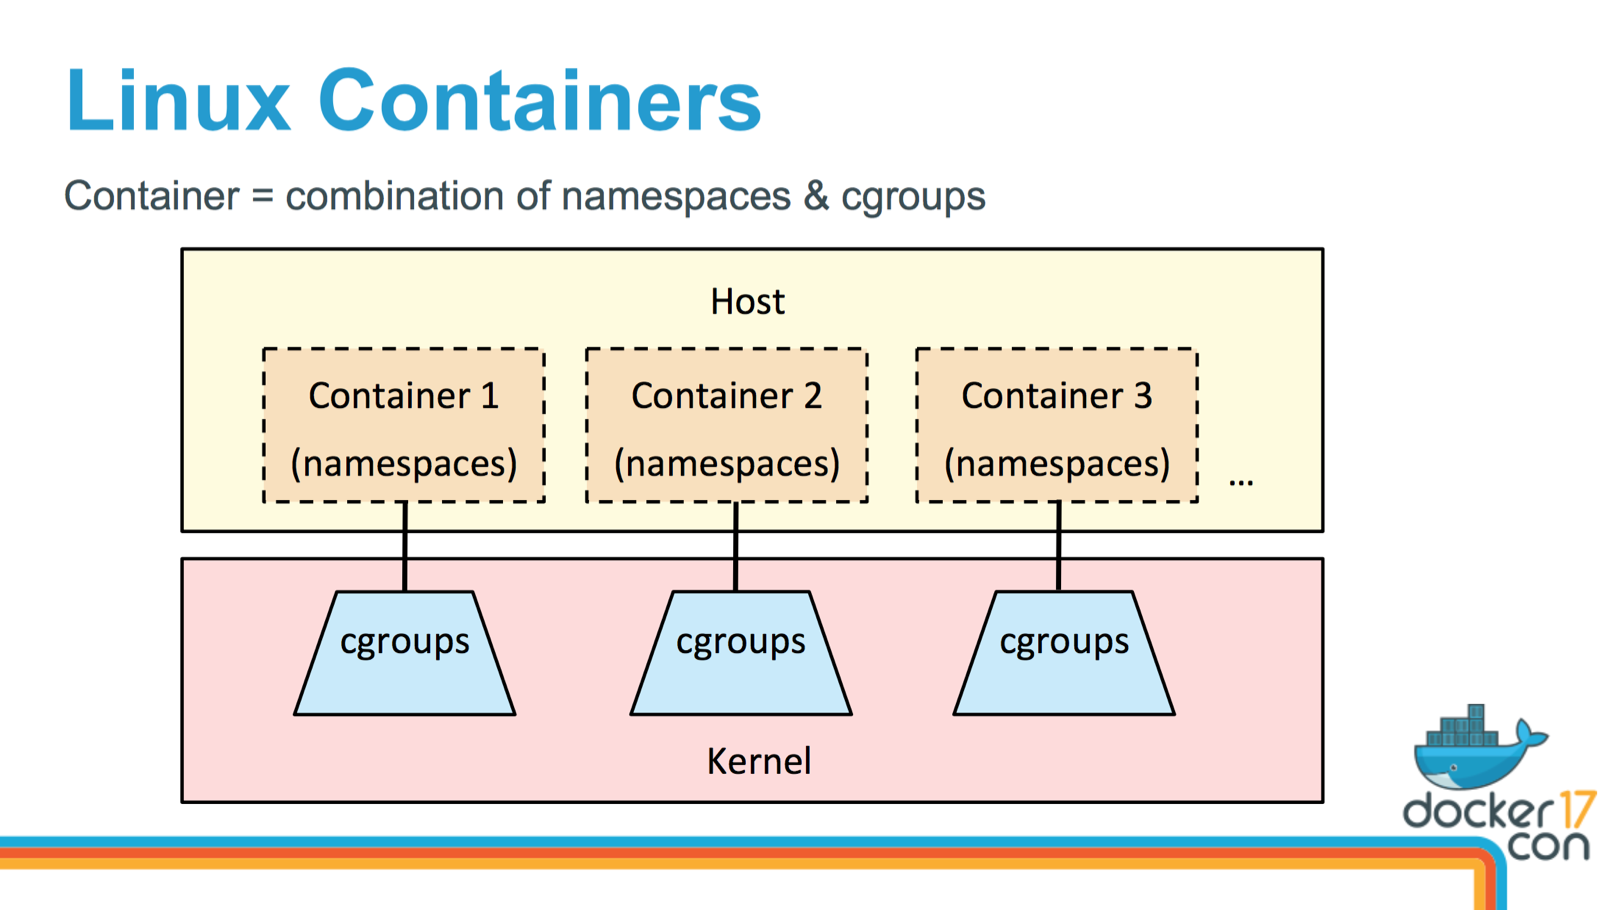
    On Linux, containers are a combination of namespaces (restriting what a process sees) and cgroups (similar to Solaris resource controls). People rarely create them manually. They use third-party software like Docker or Kubernetes to simplify their administration. I gave a talk about container performance recently at DockerCon, and included a quick summary of how they work: YouTube, SlideShare:

    If you search of slideshare and youtube, you'll find many other good talks on containers as well. Apart from Jessie, I also like talks by Jérôme Petazzoni, and Tejun Heo.

    Linux containers have been in rapid development in the last few years. It's the container team at my employer that runs the newest Linux kernels, since they need the latest features and fixes, and you should try to run the newest as well. Currently that means at least Linux 4.9.

    There's a lot about Linux containers that isn't well documented yet, especially since it's a moving target. (Zones lacked docs when they came out too, which is why I wrote the first Zones resource control docs.) Search for recent blog posts on Linux containers, and try them out, and you'll piece together their capabilities and workings bit by bit. Here are some documents for understanding internals:

    One feature Linux containers lack is a container ID in the kernel. It's been proposed on lkml, but the patches have not been integrated yet (it was last discussed two weeks ago). Some people argue that the kernel shouldn't have one, since a container is a collection of namespaces and cgroups defined in user-space (by Docker, etc), and it's therefore up to user-space to track it. As a performance engineer who does kernel tracing, I find the lack of an ID I can trace in the kernel to be pretty annoying. There are workarounds: I can use the perf_events cgroup ID, provided the container software is configuring it (they do).

    Some specific differences that got my attention: you can access a container's mount namespace from the host (global zone) via /proc/PID/root, given a PID in a container. But understanding if a PID belongs to a container is surprisingly difficult: there's no -Z option to tools like ps, since there's no container ID in the kernel. From the host (global zone), given PID 18300:

    host# grep NSpid /proc/18300/status
    NSpid:  18300   1
    host# grep 18300 /sys/fs/cgroup/perf_event/*/*/tasks
    /sys/fs/cgroup/perf_event/docker/439e9f99850a9875e890130a2469114536f8aa55d7a1b37f86201e115b27fc0f/tasks:18300

    The first command shows that PID 18300 is really PID 1 in another process namespace: a telltale sign it's in a container. I also checked a task list from /sys/fs/cgroup, and saw it's in a docker cgroup. I've suggested adding a command to docker to make listing at least the top-level PIDs in containers easier.

    Virtual Machines

    The two main technologies on Linux are Xen and KVM (and there's Bhyve for BSD). Xen is a type 1 hypervisor that runs on bare metal, and KVM is type 2 that runs as processes in a host OS. Oracle VM Server is based on Xen. Xen's biggest user is the Amazon EC2 cloud, which has over one million customers, and appears to be a custom version (it self identifies as version "3.4.3.amazon"). Outside of EC2, many other providers are deploying on KVM.

    Both Xen and KVM have had many performance and security improvements, and workloads can now be tuned to run at almost bare metal speeds (say, a 3% loss or less). At my employer we sometimes use SR-IOV for direct network interface access, and NVMe for direct disk access. Some years ago, it was easy to make the case to switch from VMs to containers due to the performance improvements alone, as VMs had to emulate everything. Not so today, although this comes at the cost of complexity and required tunables. In general, I find Xen more complicated to work with than KVM. (FWIW, I contributed some patches to Xen to allow a subset of PMCs to be accessed.)

    If you switch from managing Oracle VM to Xen, it will hopefully feel very similar. If you switch to KVM, it will be quite different, but hopefully easier.

    SMF

    I personally introduced hundreds of customers to SMF while teaching Solaris 10 classes. I came up with a great demo where I could break Solaris 9 and 10 servers in the same way, then demonstrate how it would take an hour and a reboot cycle to fix Solaris 9, but minutes and no reboot to fix Solaris 10. I also wrote and published an entertaining SMF manifest that played music. A lot of people got it and learned to love SMF. But some still hated it and the new universe of stuff one had to learn. Some vowed to remain on Solaris 9 forever in protest, or to switch to Linux.

    Linux is now going through this with systemd, and has its own share of systemd critics, encouraging distros to remove systemd. I suspect it will prevail, just as SMF did. There are many implementation differences, but the same general idea: a coordinated system to manage parallel application startup and dependency state.

    If you absolutely can't stand systemd or SMF, there is BSD, which doesn't use them. You should probably talk to someone who knows systemd very well first, because they can explain in detail why you should like it.

    Performance

    Linux should be faster out of the box for many production workloads, due to improvements in scheduling (including a tickless kernel), driver support, newer syscalls features, newer TCP feature support, processor optimizations (often provided by Intel engineers directly), a lazy TLB, and more. There's also better compiler and application support: in some cases applications run faster on Linux, not because the kernel is faster, but because that compilation target has had more attention. I've even seen cases where the Makefile compiles on Linux with -O3, and Solaris with -O0, thus crippling Solaris performance, for no legitimate reason.

    How much Linux is faster depends on the workload: I'd expect between zero and a few percent typically. There are some extreme cases, where a lack of proper driver support on Solaris can have Linux run 10x faster. I'd also expect you could still find a workload where Linux is slower. For example, although it's very minor, the /dev/*random devices were faster on Solaris last time I checked, as Linux was spending more effort on entropy for improving security. (Or, from a different point of view, Solaris was less secure.)

    I spoke about the performance differences in my 2014 SCALE keynote "What Linux can learn from Solaris performance and vice-versa" (slides) where the conclusion was that Linux may run faster out of the box, but I could typically make Solaris run much faster thanks to optimizations found using DTrace. DTrace didn't exist for Linux at the time, but now we have BPF (see previous section). There have been many other improvements to Linux since then, as well.

    Security

    Key Linux security technologies to learn:

    • AppArmor: application access control
    • seccomp: secure computing mode, restricts system call usage
    • SELinux: Security-Enhanced Linux, for access control and security policies (alternate to apparmor)
    • Linux audit: event logging
    • eBPF (which is used to enhance seccomp)
    • iptables: network firewalling
    • LSM: Linux Security Modules

    There are many more: browse the release notes on kernelnewbies. Live kernel patching is another capability, that is currently being integrated in the 4.x series. And namespaces, used for Linux containers, are also a relevant technology.

    There have been security vulnerabilities, just like there are with any software. This is especially true for Linux, which is used everywhere and has a lot of attention. The way the cloud is used helps with security: most instances at my employer have only been up for one or two days. We're constantly creating and destroying instances from a base image, which means that when we update that base image with security patches, they get rolled out very quickly.

    Reliability

    Our production servers, running Ubuntu, have been rock solid. In over three years, I've only seen three kernel panics, for an enormous deployed fleet (tens of thousands of Linux instances). Working on Solaris, I'd usually see several different panics per year. I would not attribute this to, say, a more limited range of workloads at my company: we have a wide range of different things running internally. I would, however, attribute some of it to our virtualized environment, running virtual machines: the hypervisor will handle some hardware problems before the guest kernel sees them, which I suspect helps us avoid some hardware-related panics.

    In a test environment, I've seen several more Linux panics in the past three years. Five of those were my own kernel bugs, when I was doing kernel development. Two others were on the latest "release candidate" (-rc) kernel from kernel.org– the bleeding edge of kernel development. If you do run the latest -rc kernel and hit a bug, please share on the Linux kernel developers mailing list (lkml) where it should be quickly fixed.

    In production, people often stick to the Long Term Support (LTS) kernel releases. Vendors (see later section) are usually quick to make sure these LTS kernel releases have all the right patches and are reliable. My rock solid experience with Ubuntu is on an LTS release.

    Crash Dump Analysis

    It can be done. One technique is kdump, which uses a capture kernel configured in grub. Execution switches to the capture kernel during a panic, so that a working kernel can capture the state of the system. I've set this up a few times and successfully debugged kernel panics.

    It's worth describing what commonly happens with Linux kernel panics. In an environment like ours (patched LTS kernels running in VMs), panics are rare. The odd time we hit them, we'll take the "oops message" – a dump of the kernel stack trace and other details from the system log – and search the Internet. We almost always find that someone else has hit it and had it fixed, and so then we track the patch to the kernel update and deploy that. There's so many people running Linux, and given that we're usually on LTS and not the release candidates, it's rare that we're the first to hit a panic.

    For that rare case where we are first to hit a panic: by posting the entire oops message to the right mailing list, the responsible engineer will usually fix it quick (by figuring out how to reproduce from the oops message alone), and then we track their patch into a kernel update. That mailing list would be lkml if we're running the latest rc (only in test), or the mailing list identified in the MAINTAINERS file (more on that later). In Solaris, we'd only really do panic analysis given a crash dump, but Linux gets lots of mileage from the oops message alone. Just from a quick search, see this presentation PDF, which digs into oops message components.

    Another difference: kernel panics don't always reboot the system. Linux can oops and kill a process, but not reboot if it doesn't think it needs to, instead leaving it up so you can login and debug. It's also why you should always run "dmesg" at the start of any investigation, to check if the system (that's still up!) has in fact oops'd.

    As for hitting a panic for the first time, posting an oops message, but finding no one wants to fix it: I haven't seen that yet in 3 years. The day it does happen, I'll set up the capture kernel, get a crash dump, and do the analysis myself. You can also ask your Linux OS vendor, if you are paying one for support.

    Debugging Tools

    Instead of mdb you'll be using gdb, which has been improving, and even has a TUI mode nowadays. I wrote gdb Debugging Full Example (Tutorial), and I also recommend you watch Greg Law's talk Give me 15 minutes and I'll change your view of GDB.

    I've noticed that newer projects are using lldb. Here's an lldb to gdb command map.

    Other Tools

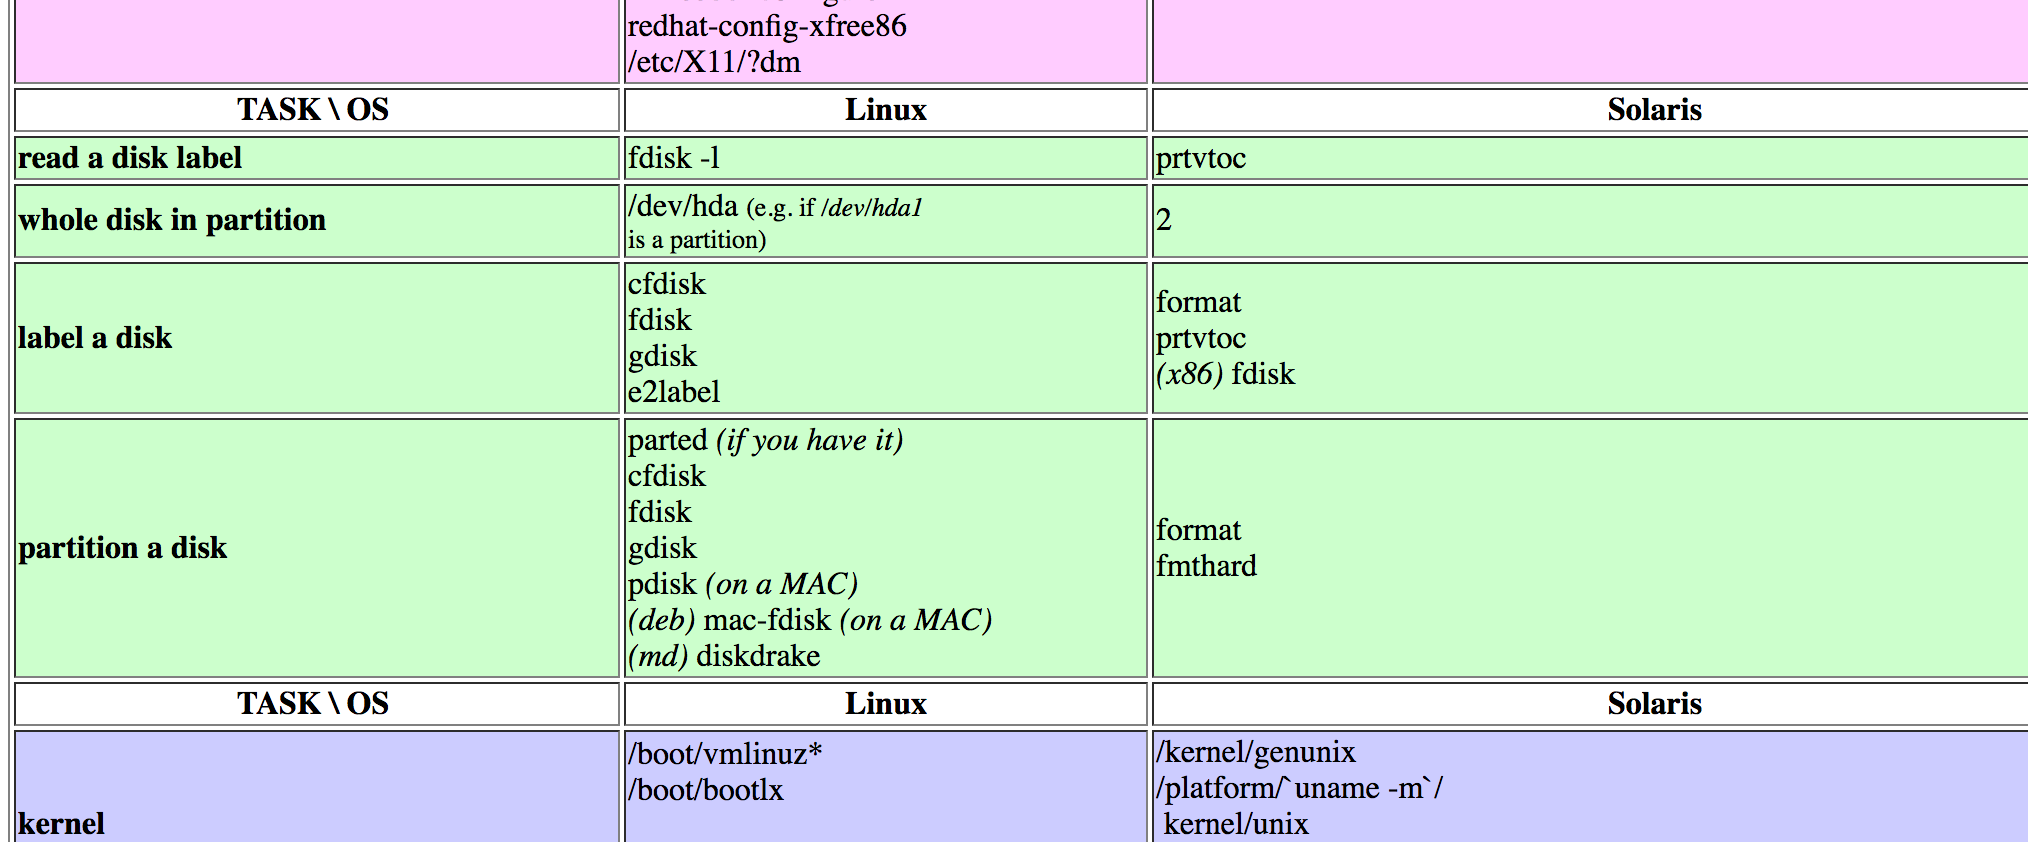
    If you never found this before, it's been a great resource over the years: the Rosetta stone of Unix, from which you can draw a table of just Linux and Solaris.

    There's also a new effort to recreate it. Oracle have a similar useful page as well: the Linux to Oracle Solaris 11 comparison, as well as a procedure for migrating from Solaris to Linux.

    A few other tool differences that stood out to me:

    • syscall tracing: truss > strace
    • packet sniffing: snoop > tcpdump
    • process tree: ptree > pstree -ps
    • kernel tuning: ndd > sysctl
    • binary dumping: elfdump > objdump
    • kernel module list: modinfo > lsmod
    • swap status (swap often isn't used): swap > swapon

    Other Kernel Differences

    Linux supports overcommit: instead of guaranteeing that all virtual memory can be stored when needed, including on swap devices, Linux bets that it won't need to, so allows more virtual memory allocations than it could possibly store. This means that malloc() almost always returns successfully, so much so that some programmers on Linux don't bother checking its return value. What happens if processes really do try to populate all that virtual memory? The system runs out, and the kernel's out-of-memory killer (OOM killer) will pick a sacrificial process and kill it. If that seems wildly unacceptable, note that you can tune overcommit on Linux to not do this, and behave more like Solaris (see sysctl vm.overcommit_memory).

    I covered various kernel differences in my SCALE 2014 talk What Linux can learn from Solaris performance and vice-versa, and of course my book Systems Performance: Enterprise and the Cloud where I cover both Linux and Solaris.

    OS Vendors and Paying for Linux

    If you're already an Oracle customer and switch to Linux, then there is Oracle Linux. Other vendors who offer support include Red Hat, Canonical, and SUSE.

    However, most companies don't pay for Linux. How does it get developed? Often companies want features and will develop and upstream them to meet their own needs. But once it's part of mainline Linux, their contribution may end there. There may be no real documentation written, no marketing of the feature, and no education of the community. Just code that appears in the Linux source because IBM/Cisco/Hitachi/whoever needed it there for their own internal project. This lack of supporting efforts can make learning Linux capabilities more challenging.

    Linux Kernel Engineering

    If you want to get into Linux kernel development, you'll need to get familiar with Coding Style, Submitting Patches, and the Submit Checklist. You could also read On submitting kernel patches (see section 14.1 and imagine how different Solaris would be if Linux accepted that patch!).

    There are also many blog posts on how to compile the Linux kernel and submit your first patch, just search for "compiling the Linux kernel". It can be menu driven or automated. Just as an example, here's my build script for automating Linux kernel builds for my custom EC2 environment (it's custom, you don't want to use it, just giving you an idea).

    You'll especially want to understand the MAINTAINERS file. It's very unlikely you'll be submitting patches to Linus Torvalds (nor the github repo, read why). You'll almost always be sending your patches to "maintainers", who will do code review and then pass your patch on to Linus. There are over one thousand subsystems in Linux (many for device drivers), each has one or more maintainers. Maintainers make the day-to-day decisions in Linux development. Apart from reading the MAINTAINERS file (which includes a legend at the top), you can query it. Eg, to see who maintains tcp_output.c:

    linux$ ./scripts/get_maintainer.pl -f net/ipv4/tcp_output.c
    "David S. Miller"  (maintainer:NETWORKING [IPv4/IPv6])
    Alexey Kuznetsov  (maintainer:NETWORKING [IPv4/IPv6])
    James Morris  (maintainer:NETWORKING [IPv4/IPv6])
    Hideaki YOSHIFUJI  (maintainer:NETWORKING [IPv4/IPv6])
    Patrick McHardy  (maintainer:NETWORKING [IPv4/IPv6])
    netdev@vger.kernel.org (open list:NETWORKING [IPv4/IPv6])
    linux-kernel@vger.kernel.org (open list)

    The MAINTAINERS file also shows the mailing lists for each subsystem. Patches often get hashed out there and polished long before they are sent by the maintainer to Linus on lkml.

    The kernel development cycle: It begins with a new release (eg, 4.13), and then every Sunday (or whenever Linus decides) a release candidate in posted. So there'll be 4.13-rc1, then 4.13-rc2, etc, usually up to -rc7 or -rc8, which will be the final release candidates, and then Linus will cut the next release (eg, 4.14). All major changes are supposed to go in the first or second release candidate, and then minor bug fixes by rc7. For example, Linus just released 4.13, saying:

    So last week was actually somewhat eventful, but not enough to push me
    to delay 4.13.
    
    Most of the changes since rc7 are actually networking fixes, the bulk
    of them to various drivers. With apologies to the authors of said
    patches, they don't look all that interesting (which is definitely
    exactly what you want just before a release).  Details in the appended
    shortlog.
    [...]
    

    If you make some major changes or feature additions, and Linux is currently on rc3 or later, your patches are unlikely to be integrated in that release. The maintainers will hold on to them: they often have their own forks of Linux for this purpose.

    As for brilliant jerks: Linux has them. So did Solaris. You know what I mean: the difference between saying "this code is idiotic" (probably ok) and "you are an idiot" (probably not ok). I don't believe in such behavior, and I think it's even more problematic for Linux given so many volunteers who could choose to do something else if pushed the wrong way. Fortunately, my own experience with Linux has been largely positive.

    To get started on Linux kernel development, I'd subscribe to lkml and other lists, then offer to code review and test patches that you see posted. A lot of people are writing code, but fewer offering to help code review and test (and write docs). This should be an easy way to get started, build some credibility, and make valuable contributions. Sometimes good patches are posted and slip through the cracks, so replying with "I tested it, it works, thanks!" can help get things integrated, and the engineers will be grateful for your help.

    Community & Experts

    The Linux community is massive. Here are areas you should know about:

    • kernelnewbies: Posts changelogs for each Linux release (eventually), highlighting major and minor additions.
    • lkml: The Linux Kernel Mailing List. This is the final staging ground for patches to be integrated into Linux, so following this will let you see what's happening right now. Be warned that it's high volume, and there are only a few reasons you should ever post there: 1. you are submitting a patch set and the MAINTAINERS file told you to CC lkml; 2. you are providing constructive expert comments on someone else's patch set, ideally after you tested it; or 3. you're running the latest -rc from kernel.org (or github/torvalds/linux) and hit a bug/panic.
    • lwn.net: The best news feed of what's happening in Linux. It requires a subscription to read the latest articles, but if Linux is going to be a big part of your job, it's worth it.

    Many of the experts in the Linux community are maintainers, as listed in the MAINTAINERS file. It's rare to bump into a maintainer: those I know keep their heads down working on lkml and the sublists, and usually avoid blog posts, meetups, and conferences (with some exceptions, like Linux Plumbers: an exclusive event for kernel engineers only, NetDev, and Kernel Recipes. Which reminds me: I'm helping run the tracing micro conference at Plumbers this year, and I'm also speaking at Kernel Recipes, so if you manage to make it to either, I'll see you there.)

    There was a phenomenon in Solaris where we, the engineers, began doing our own marketing and evangelism, out of desperation to save Solaris. I've never found that happening in Linux, where there's the belief that Linux is too big to fail. I think that is a weakness of Linux. When I first joined Sun in 2001, it was believed that Sun was too big to fail, as well. Nowadays, Sun is a cobweb-covered sign at the Facebook Menlo Park campus, kept as a warning to the next generation.

    Documentation

    The best documentation is under /Documentation in the kernel source (online at kernel.org/doc or github/torvalds). That documentation is correct but terse, written by the engineers as they commit code.

    Full documentation for features, such as would be published by Sun, is often non-existent. Even the major releases can go undocumented for weeks until someone writes a summary on kernelnewbies, which is about as close to official release notes as you can get. I think the problem is a lack of paid tech writers working on Linux. Who would pay them?

    This lack of documentation makes learning and discovering new Linux features difficult.

    Other Differences

    • Packaging: on Ubuntu (and similar) use "apt", on Red Hat (and similar) use "yum". They make it very easy to install packages, and automatically handle dependencies.
    • Driver & Platform Support: Linux runs on practically everything.
    • Server Application Support: Linux is usually the development environment for server applications, where things are most likely to work.
    • Desktop Support: I miss CDE and dtksh. There's a lot of options on Linux, but I'm out of touch with current desktop environments, so can't recommend any.

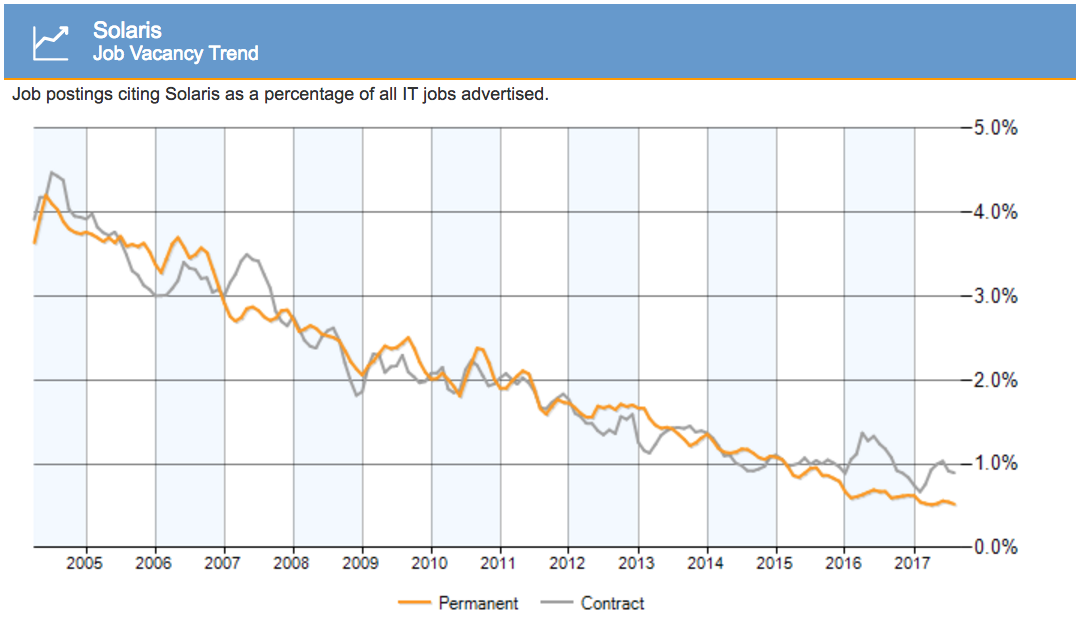
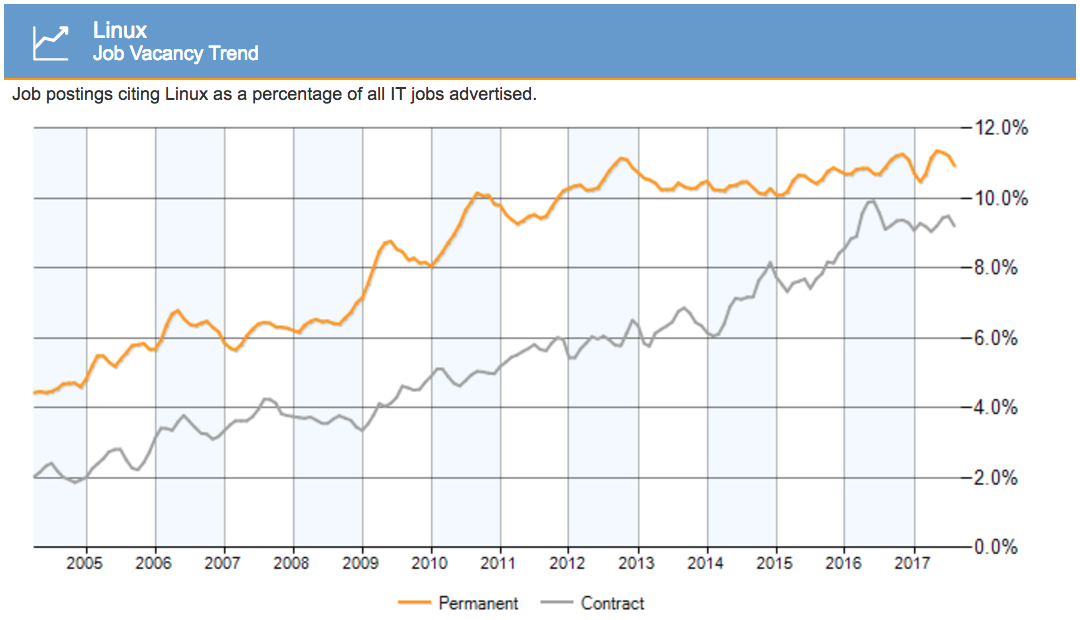
    Job Market

    The Linux job market Linux has been much healthier for a while and growing. Solaris vs Linux jobs in the UK:


    Source: www.itjobswatch.co.uk

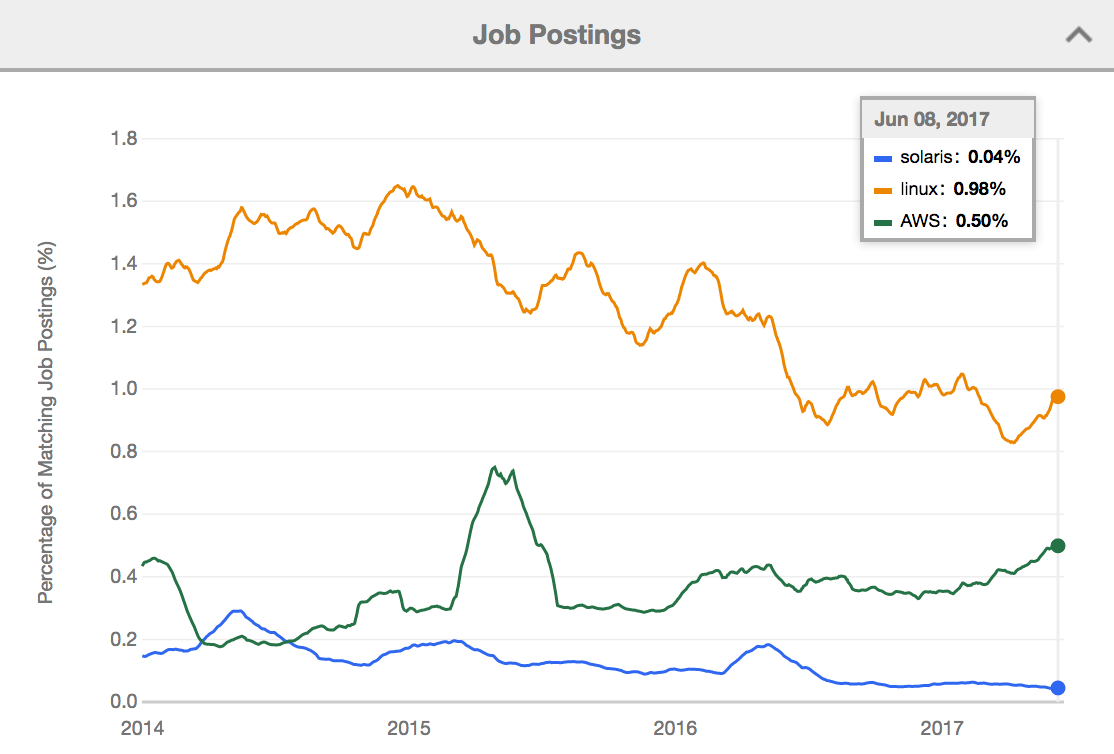
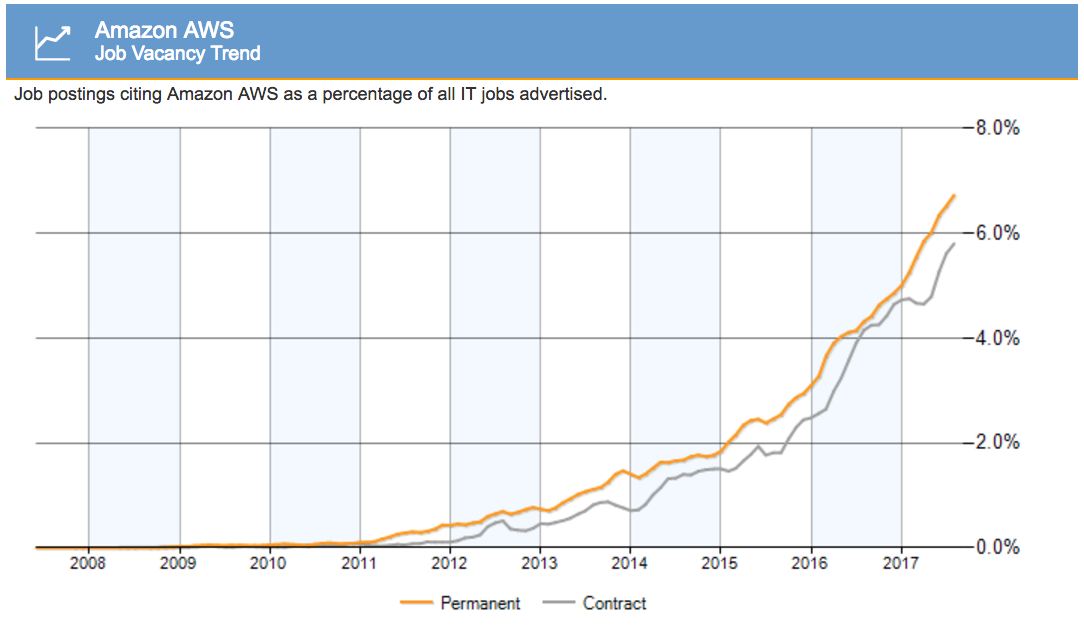
    But there's another factor at play: jobs are also migrating from both Solaris and Linux to cloud jobs instead, specifically AWS. From another tracker, for the US:


    Source: www.indeed.com

    The market for OS and kernel development roles is actually shrinking a little. The OS is becoming a forgotten cog in a much larger cloud-based system. The UK tracker plots the growth in AWS jobs clearly:

    The job growth is in distributed systems, cloud SRE, data science, cloud network engineering, traffic and chaos engineering, container scheduling, and other new roles. While you might be considering switching to an equivalent Linux or BSD job, you should also consider a new role if that interests you. Leapfrogging to the next big thing was one of Deirdré Straughan's suggestions in Letting Go of a Beloved Technology.

    I suspect at some point there'll be more jobs supporting the AWS cloud than there will be supporting Linux. If you choose this route, AWS makes it very easy to create servers (you just need a credit card) and learn how to use them. Which is also why it's been so successful: developers can create servers when they want them, without having to ask and wait for the system administration team.

    As for companies: I can recommend Netflix, which has a culture that works really well.

    If you stay working on the OS and kernel, there are still many jobs in support and development, and always will be. Large companies (like the one I work for) have OS teams to look after patching, releases, and performance. Appliance manufacturers hire kernel engineers to develop custom features, including storage appliances. There are several ZFS-based startups, who would appreciate your experience on ZFS.

    Good Luck

    This is the post I wish someone had written for me when I made the switch. The first few months were the hardest. It gets easier. It will also become easier if you contribute to Linux, or BSD, and fix the annoying things you discover. Solaris may not survive, but certain technologies and expertise will.

    Here's the Sun I'd like to remember: lots of smart people, having fun, and doing great work (music might not play outside the US):

    RIP, Sun.

    Good luck to all, and let the spirit of great engineering live on in the next projects you choose.

    References

    ZFS

    Observability

    DTrace

    Zones

    Performance

    Security

    Crash Dump & Debugging

    Other Tools & Kernel Differences

    Linux Kernel Engineering

    Community & Experts

    Documentation

    Job Market

    Thanks to Deirdré Straughan for edits. Now to write a BSD version of this post...
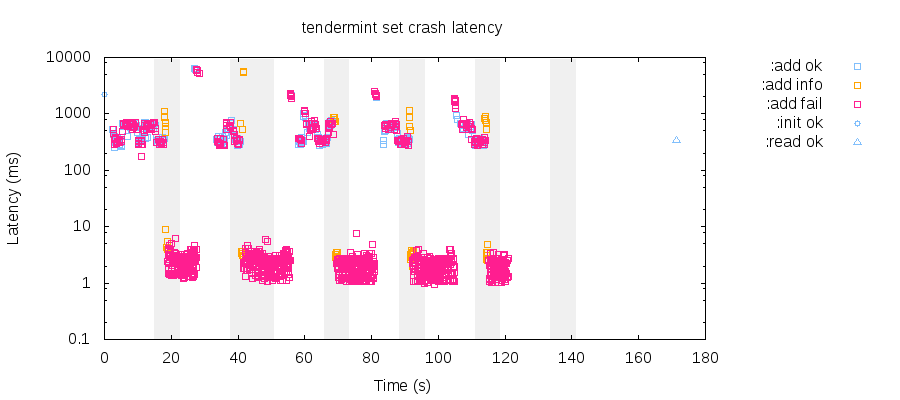
    You can comment here, but I can't guarantee your comment will remain here forever: I might switch comment systems at some point (eg, if disqus add advertisements).

    Efficient Air-Conditioning Beams Heat into Space

    $
    0
    0

    Air-conditioners work hard in hot weather, hogging energy. With a warming climate and more people across the world cranking up ACs, more efficient cooling systems are going to become critical to reduce energy use and greenhouse gas emissions. 

     Stanford researchers have developed a cooling system that could cut the energy used by conventional building air-conditioning systems by over 20 percent in the middle of summer.

     Conventional air-conditioners use a refrigerant to absorb heat from inside a house and release it outdoors. Fans blow air over condenser coils to vent heat into the air, which takes a lot of energy. “The efficiency of cooling systems depends on air temperature,” says Aaswath Raman, an applied physicist at Stanford. “If the air is warmer then the system works harder and uses more electricity to reject that heat into the environment.” 

     The Stanford team’s passive cooling system chills water by a few degrees with the help of radiative panels that absorb heat and beam it directly into outerspace. This requires minimal electricity and no water evaporation, saving both energy and water. The researchers want to use these fluid-cooling panels to cool off AC condensers.

     They first reported their passive radiative cooling idea in 2014. In the new work reported in Nature Energy, they’ve taken the next step with a practical system that chills water. They’ve also established a startup, SkyCool Systems, to commercialize the technology.

    Radiative cooling relies on the fact that most objects release heat. “The sun heats up objects during the day, and at night the Earth’s surface or building roofs all radiate that back to the sky,” Raman says. Problem is, radiative cooling doesn’t work during the day while the sun’s beating down on the Earth, or when the ambient air temperature is very high.

    So Raman and electrical engineering professor Shanhui Fan made panels containing layers of silicon dioxide and hafnium oxide on top of a thin layer of silver. These radiate in a unique way: They send heat directly into space, bypassing the Earth’s atmosphere. The panels do this by emitting heat at infrared wavelengths between 8 and 13 micrometers. To these waves, the Earth’s atmosphere is transparent. What’s more, the panels reflect nearly all the sunlight falling on them.

    For the new fluid-cooling system, the researchers made radiative panels that were each one-third of a square meter in area; they attached the panels to an aluminum heat exchanger plate with copper pipes embedded in it. The setup was enclosed in an acrylic box covered with a plastic sheet.

    The team tested it on a rootop on the Stanford campus. Over three days of testing, they found that water temperatures went down by between 3- and 5 °C. The only electricity it requires is what’s needed to pump water through the copper pipes. Water that flowed more slowly was cooled more.

    As a practical application for the system, the researchers built a model in which the radiative water-cooling panels cool the condenser coils of a building’s air-conditioning system, providing an assist to the system’s cooling fans. The circulating fluid helps siphon more heat from the condenser, increasing efficiency. Water that’s cooled by only a few degrees can make a big difference: In general, the electricity needed for a cooling system is reduced by 3 to 5 percent for every degree Celcius the condenser temperature drops. 

    The model showed that cooling a two-story commercial office building in Las Vegas with fluid-cooling panels—which covered 60 percent of the roof—cut the building’s electricity use by 21 percent compared with using only a traditional fan-based condenser during the hot summer months of May through August.

    New radiant cooling systems, which use chilled water running through aluminum panels or pipes, are getting more common in Europe and China and in high-efficiency buildings in the U.S., says Raman. “If we could couple our system with such radiant cooling systems, we could get 70 percent efficiency savings.”

    WinBtrfs – A Windows driver for the next-generation Linux filesystem Btrfs

    $
    0
    0

    README.md

    WinBtrfs v1.0

    WinBtrfs is a Windows driver for the next-generation Linux filesystem Btrfs. A reimplementation from scratch, it contains no code from the Linux kernel, and should work on any version from Windows 7 onwards. First, a disclaimer:

    This software is in active development - YOU USE IT AT YOUR OWN RISK. I take NO RESPONSIBILITY for any damage it may do to your filesystem. DO NOT USE THIS DRIVER UNLESS YOU HAVE FULL AND UP-TO-DATE BACKUPS OF ALL YOUR DATA. Do not rely on Btrfs' internal mechanisms: SNAPSHOTS ARE NOT BACKUPS, AND DO NOT RULE OUT THE POSSIBILITY OF SILENT CORRUPTION.

    In other words, assume that the driver is going to corrupt your entire filesystem, and you'll be pleasantly surprised when it doesn't.

    However, having said that, it ought to be suitable for day-to-day use.

    Everything here is released under the GNU Lesser General Public Licence (LGPL); see the file LICENCE for more info. You are encouraged to play about with the source code as you will, and I'd appreciate a note (mark@harmstone.com) if you come up with anything nifty. On top of that, I'm open to relicensing the code if you've a burning desire to use it on a GPL or commercial project, or what have you - drop me a line and we'll talk.

    See at the end of this document for copyright details of third-party code that's included here.

    Donations

    I've been developing this driver for fun, and in the hopes that someone out there will find it useful. But if you want to provide some pecuniary encouragement, it'd be very much appreciated:

    Features

    • Reading and writing of Btrfs filesystems
    • Basic RAID: RAID0, RAID1, and RAID10
    • Advanced RAID: RAID5 and RAID6 (incompat flag raid56)
    • Caching
    • Discovery of Btrfs partitions, even if Windows would normally ignore them
    • Getting and setting of Access Control Lists (ACLs), using the xattr security.NTACL
    • Alternate Data Streams (e.g. :Zone.Identifier is stored as the xattr user.Zone.Identifier)
    • Supported incompat flags: mixed_backref, default_subvol, big_metadata,extended_iref, skinny_metadata.
    • Mappings from Linux users to Windows ones (see below)
    • Symlinks and other reparse points
    • Shell extension to identify and create subvolumes, including snapshots
    • Hard links
    • Sparse files
    • Free-space cache
    • Preallocation
    • Asynchronous reading and writing
    • Partition-less Btrfs volumes
    • Per-volume registry mount options (see below)
    • zlib compression
    • LZO compression (incompat flag compress_lzo)
    • Misc incompat flags: mixed_groups, no_holes
    • LXSS ("Ubuntu on Windows") support
    • Balancing (including resuming balances started on Linux)
    • Device addition and removal
    • Creation of new filesystems with mkbtrfs.exe and ubtrfs.dll
    • Scrubbing
    • TRIM/DISCARD
    • Reflink copy
    • Subvol send and receive
    • Degraded mounts
    • Free space tree (compat_ro flag free_space_cache)
    • Shrinking and expanding

    Todo

    • Passthrough of permissions etc. for LXSS
    • Oplocks

    Installation

    The driver is self-signed at the moment, meaning that if you're using a 64-bit version of Windows you'll have to tell it to boot up in Test Mode if you want it to work. To do this, launch an admin command prompt (right-click on "Command Prompt" and click "Run as administrator"), and run the following command:

    bcdedit -set TESTSIGNING ON

    Reboot, and you should see "Test Mode" on the bottom right of the Desktop. You may need to disable "Secure Boot" in BIOS for this to work.

    To install the driver, right-click btrfs.inf and choose Install.

    Uninstalling

    If you want to uninstall, go to Device Manager, find "Btrfs controller" under "Storage volumes", right click and choose "Uninstall". Tick the checkbox to uninstall the driver as well, and let Windows reboot itself.

    If you need to uninstall via the registry, open regedit and set the value of HKLM\SYSTEM\CurrentControlSet\services\btrfs\Start to 4, to disable the service. After you reboot, you can then delete the btrfs key and remove C:\Windows\System32\drivers\btrfs.sys.

    Compilation

    You will need Microsoft Visual C++ 2015 if you want to compile the driver; you might be able to get earlier versions to work with a bit of work.

    You'll also need a copy of the Windows DDK; I placed mine in C:\WinDDK. If yours is somewhere else, you'll need to edit the project settings. You'll also need to edit the post-build steps for the 64-bit versions, which are set up to self-sign using my own certificate.

    Mappings

    The user mappings are stored in the registry key HKLM\SYSTEM\CurrentControlSet\services\btrfs\Mappings. Create a DWORD with the name of your Windows SID (e.g. S-1-5-21-1379886684-2432464051-424789967-1001), and the value of your Linux uid (e.g. 1000). It will take effect next time the driver is loaded.

    You can find your current SID by running wmic useraccount get name,sid.

    Similarly, the group mappings are stored in under GroupMappings. The default entry maps Windows' Users group to gid 100, which is usually "users" on Linux. You can also specify user SIDs here to force files created by a user to belong to a certain group. The setgid flag also works as on Linux.

    Commands

    The DLL file shellbtrfs.dll provides the GUI interface, but it can also be used with rundll32.exe to carry out some tasks from the command line, which may be useful if you wish to schedule something to run periodically.

    Bear in mind that rundll32 provides no mechanism to return any error codes, so any of these commands may fail silently.

    • rundll32.exe shellbtrfs.dll,CreateSubvol <path>

    • rundll32.exe shellbtrfs.dll,CreateSnapshot <source> <destination>

    • rundll32.exe shellbtrfs.dll,ReflinkCopy <source> <destination> This also accepts wildcards, and any number of source files.

    The following commands need various privileges, and so must be run as Administrator to work:

    • rundll32.exe shellbtrfs.dll,SendSubvol <source> [-p <parent>] [-c <clone subvol>] <stream file> The -p and -c flags are as btrfs send on Linux. You can specify any number of clone subvolumes.

    • rundll32.exe shellbtrfs.dll,RecvSubvol <stream file> <destination>

    • rundll32.exe shellbtrfs.dll,StartScrub <drive>

    • rundll32.exe shellbtrfs.dll,StopScrub <drive>

    Troubleshooting

    • My drive doesn't show up!

    If you're on 64-bit Windows, check that you're running in Test Mode ("Test Mode" appears in the bottom right of the Desktop).

    Check that you've not got the new free space cache enabled, which isn't yet supported.

    • The filenames are weird! or
    • I get strange errors on certain files or directories!

    The driver assumes that all filenames are encoded in UTF-8. This should be the default on most setups nowadays - if you're not using UTF-8, it's probably worth looking into converting your files.

    • btrfs check reports errors in the extent tree

    There's a bug in btrfs-progs v4.7, which causes it to return false positives when using prealloc extents - this'll also manifest itself with filesystems from the official driver. If you still get the same errors when using btrfs-check v4.6, please e-mail me what it says.

    • The root of the drive isn't case-sensitive in LXSS

    This is something Microsoft hardcoded into LXSS, presumably to stop people hosing their systems by running mkdir /mnt/c/WiNdOwS.

    • Disk Management doesn't work properly, e.g. unable to change drive letter

    Try changing the type of your partition in Linux. For MBR partitions, this should be type 7 in fdisk. For GPT partitions, this should be type 6 in fdisk ("Microsoft basic data"), or 0700 in gdisk. We have to do some chicanery to get Linux partitions to appear in the first place, but unfortunately this confuses diskmgmt.msc too much.

    • How do I format a partition as Btrfs?

    Use the included command line program mkbtrfs.exe. We can't add Btrfs to Windows' own dialog box, unfortunately, as its list of filesystems has been hardcoded. You can also run format /fs:btrfs, if you don't need to set any Btrfs-specific options.

    • I can't reformat a mounted Btrfs filesystem

    If Windows' Format dialog box refuses to appear, try running format.com with the /fs flag, e.g. format /fs:ntfs D:.

    Changelog

    v1.0 (2017-09-04):

    • First non-beta release!
    • Degraded mounts
    • New free space cache (compat_ro flag free_space_cache)
    • Shrinking and expanding of volumes
    • Registry options now re-read when changed, rather than just on startup
    • Improved balancing on very full filesystems
    • Fixed problem preventing user profile directory being stored on btrfs on Windows 8 and above
    • Better Plug and Play support
    • Miscellaneous bug fixes

    v0.10 (2017-05-02):

    • Reflink copy
    • Sending and receiving subvolumes
    • Group mappings (see Mappings section above)
    • Added commands for scripting etc. (see Commands section above)
    • Fixed an issue preventing mounting on non-PNP devices, such as VeraCrypt
    • Fixed an issue preventing new versions of LXSS from working
    • Fixed problem with the ordering of extent refs, which caused problems on Linux but wasn't picked up by btrfs check
    • Added support for reading compressed inline extents
    • Many miscellaneous bug fixes

    v0.9 (2017-03-05):

    • Scrubbing
    • TRIM/DISCARD
    • Better handling of multi-device volumes
    • Performance increases when reading from RAID filesystems
    • No longer lies about being NTFS, except when it has to
    • Volumes will now go readonly if there is an unrecoverable error, rather than blue-screening
    • Filesystems can now be created with Windows' inbuilt format.com
    • Zlib upgraded to version 1.2.11
    • Miscellaneous performance increases
    • Miscellaneous bug fixes

    v0.8 (2016-12-30):

    • Volume property sheet, for:
    • Balances
    • Adding and removing devices
    • Showing disk usage, i.e. the equivalent to btrfs fi usage
    • Checksums now calulated in parallel where appropriate
    • Creation of new filesystems, with mkbtrfs.exe
    • Plug and play support for RAID devices
    • Disk usage now correctly allocated to processes in taskmgr
    • Performance increases
    • Miscellaneous bug fixes

    v0.7 (2016-10-24):

    • Support for RAID5/6 (incompat flag raid56)
    • Seeding support
    • LXSS ("Ubuntu on Windows") support
    • Support for Windows Extended Attributes
    • Improved removable device support
    • Better snapshot support
    • Recovery from RAID checksum errors
    • Fixed issue where creating a lot of new files was taking a long time
    • Miscellaneous speed increases and bug fixes

    v0.6 (2016-08-21):

    • Compression support (both zlib and lzo)
    • Mixed groups support
    • No-holes support
    • Added inode property sheet to shell extension
    • Many more mount options (see below)
    • Better support for removable devices
    • Page file support
    • Many miscellaneous bug fixes

    v0.5 (2016-07-24):

    • Massive speed increases (from "sluggish" to "blistering")
    • Massive stability improvements
    • RAID support: RAID0, RAID1, and RAID10
    • Asynchronous reading and writing
    • Partition-less Btrfs volumes
    • Windows sparse file support
    • Object ID support
    • Beginnings of per-volume mount options
    • Security improvements
    • Notification improvements
    • Miscellaneous bug fixes

    v0.4 (2016-05-02):

    • Subvolume creation and deletion
    • Snapshots
    • Preallocation
    • Reparse points
    • Hard links
    • Plug and play
    • Free-space cache
    • Fix problems preventing volume from being shared over the network
    • Miscellaneous bug fixes

    v0.3 (2016-03-25):

    • Bug fixes:
    • Fixed crashes when metadata blocks were SINGLE, such as on SSDs
    • Fixed crash when splitting an internal tree
    • Fixed tree traversal failing when first item in tree had been deleted
    • Fixed emptying out of whole tree (probably only relevant to checksum tree)
    • Fixed "incorrect local backref count" message appearing in btrfs check
    • Miscellaneous other fixes
    • Added beginnings of shell extension, which currently only changes the icon of subvolumes

    v0.2 (2016-03-13):

    • Bug fix release:
    • Check memory allocations succeed
    • Check tree items are the size we're expecting
    • Added rollbacks, so failed operations are completely undone
    • Fixed driver claiming all unrecognized partitions (thanks Pierre Schweitzer)
    • Fixed deadlock within CcCopyRead
    • Fixed changing properties of a JPEG within Explorer
    • Lie about FS type, so UAC works
    • Many, many miscellaneous bug fixes
    • Rudimentary security support
    • Debug log support (see below)

    v0.1 (2016-02-21):

    Debug log

    WinBtrfs has three levels of debug messages: errors and FIXMEs, warnings, and traces. The release version of the driver only displays the errors and FIXMEs, which it logs via DbgPrint. You can view these messages via the Microsoft program DebugView, available at https://technet.microsoft.com/en-gb/sysinternals/debugview.

    If you want to report a problem, it'd be of great help if you could also attach a full debug log. To do this, you will need to use the debug versions of the drivers; copy the files in Debug\x64 or Debug\x86 into x64 or x86. You will also need to set the registry entries in HKLM\SYSTEM\CurrentControlSet\Services\btrfs:

    • DebugLogLevel (DWORD): 0 for no messages, 1 for errors and FIXMEs, 2 for warnings also, and 3 for absolutely everything, including traces.
    • LogDevice (string, optional): the serial device you want to output to, such as\Device\Serial0. This is probably only useful on virtual machines.
    • LogFile (string, optional): the file you wish to output to, if LogDevice isn't set. Bear in mind this is a kernel filename, so you'll have to prefix it with "\??\" (e.g., "\??\C:\btrfs.log"). It probably goes without saying, but don't store this on a volume the driver itself is using, or you'll cause an infinite loop.

    Mount options

    The driver will create subkeys in the registry under HKLM\SYSTEM\CurrentControlSet\Services\btrfs for each mounted filesystem, named after its UUID. If you're unsure which UUID refers to which volume, you can check using btrfs fi show on Linux. You can add per-volume mount options to this subkey, which will take effect on reboot. If a value is set in the key above this, it will use this by default.

    • Ignore (DWORD): set this to 1 to tell the driver not to attempt loading this filesystem. With the `Readonly flag, this is probably redundant.

    • Readonly (DWORD): set this to 1 to tell the driver not to allow writing to this volume. This is the equivalent of the ro flag on Linux.

    • Compress (DWORD): set this to 1 to tell the driver to write files as compressed by default. This is the equivalent of the compress flag on Linux.

    • CompressForce (DWORD): set this to 1 to force compression, i.e. to ignore the nocompress inode flag and even attempt compression of incompressible files. This isn't a good idea, but is the equivalent of the compress-force flag on Linux.

    • CompressType (DWORD): set this to 1 to prefer zlib compression, and 2 to prefer lzo compression. The default is 0, which uses lzo compression if the incompat flag is set, and zlib otherwise.

    • FlushInterval (DWORD): the interval in seconds between metadata flushes. The default is 30, as on Linux - the parameter is called commit there.

    • ZlibLevel (DWORD): a number between -1 and 9, which determines how much CPU time is spent trying to compress files. You might want to fiddle with this if you have a fast CPU but a slow disk, or vice versa. The default is 3, which is the hard-coded value on Linux.

    • MaxInline (DWORD): the maximum size that will be allowed for "inline" files, i.e. those stored in the metadata. The default is 2048, which is also the default on modern versions of Linux - the parameter is called max_inline there. It will be clipped to the maximum value, which unless you've changed your node size will be a shade under 16 KB.

    • SubvolId (QWORD): the ID of the subvolume that we will attempt to mount as the root. If it doesn't exist, this parameter will be silently ignored. The subvolume ID can be found on the inode property sheet; it's in hex there, as opposed to decimal on the Linux tools. The default is whatever has been set via btrfs subvolume set-default; or, failing that, subvolume 5. The equivalent parameter on Linux is called subvolid.

    • SkipBalance (DWORD): set to 1 to tell the driver not to attempt resuming a balance which was running when the system last powered down. The default is 0. The equivalent parameter on Linux is skip_balance.

    • NoPNP (DWORD): useful for debugging only, this forces any volumes to appear rather than exposing them via the usual Plug and Play method.

    Contact

    I'd appreciate any feedback you might have, positive or negative:mark@harmstone.com.

    Copyright

    This code also contains portions of zlib, which is licensed as follows:

    Copyright (C) 1995-2017 Jean-loup Gailly and Mark Adler

    This software is provided 'as-is', without any express or implied warranty. In no event will the authors be held liable for any damages arising from the use of this software.

    Permission is granted to anyone to use this software for any purpose, including commercial applications, and to alter it and redistribute it freely, subject to the following restrictions:

    1. The origin of this software must not be misrepresented; you must not claim that you wrote the original software. If you use this software in a product, an acknowledgment in the product documentation would be appreciated but is not required.
    2. Altered source versions must be plainly marked as such, and must not be misrepresented as being the original software.
    3. This notice may not be removed or altered from any source distribution.

    It also contains portions of an early version of lzo, which is copyright 1996 Markus Oberhumer. Modern versions are licensed under the GPL, but this was licensed under the LGPL, so I believe it is okay to use.

    Divorce and Occupation

    $
    0
    0

    As people are marrying later and staying single longer, divorce continues to be common in the United States. It’s not the mythical“half of marriages end in divorce” common, but the percentages are up there.

    Divorce rates vary a lot by group though. Rates are higher for the unemployed than employed. Divorce among Asians tends to be much lower than other races. Rates change a lot by education level.

    So, let’s look at divorce rates by occupation. Using data from the 2015 American Community Survey, for each occupation, I calculated the percentage of people who divorced out of those who married at least once.

    Each dot represents an occupation. Mouse over for details.

    How fitting it is to see actuaries, assessors of risk and uncertainty, at the bottom with the lowest rate.
     

    Below is a split view for each occupation category, sorted by highest median rate to lowest. Those in transportation and material moving, such as flight attendants and bus drivers, tend to have higher divorce rates. Those in architecture and engineering tend to have lower divorce rates.

    It kind of looked like salary might be related. After all, education level seems to be. So, here’s divorce rates plotted against median salary per occupation. It’s looking downward slopey.

    Those with higher salary occupations tend to have lower divorce rates. That seems pretty clear. But as you know, correlation isn’t causation. If someone who is already a physician, quits and takes a job as a bartender or telemarketer, it doesn’t mean their chances of divorce changes. It probably says more about the person than anything else.

    Similarly, those with certain occupations tend to be from similar demographics, which then factors into how the individuals live their lives. But still — interesting. I’m still amused that actuaries ended up with the lowest rate.

    Notes

    GitHub static assets blocked by its own CORS policy

    $
    0
    0

    Code security

    Prevent problems before they happen. Protected branches, signed commits, and required status checks protect your work and help you maintain a high standard for your code.

    Access controlled

    Encourage teams to work together while limiting access to those who need it with granular permissions and authentication through SAML/SSO and LDAP.

    Hosted where you need it

    Securely and reliably host your work on GitHub.com. Or, deploy GitHub Enterprise on your own servers or in a private cloud using Amazon Web Services, Azure or Google Cloud Platform.

    Flash Dumping – Part I

    $
    0
    0

    First part of a blog post series about our approach to dump a flash chip. In this article we describe how to desolder the flash, design and build the corresponding breakout board.

    This blog post series will detail simple yet effective attacks against embedded devices non-volatile memories. This type of attack enables you to do the following:

    • read the content of a memory chip;
    • modify the content of a memory chip;
    • monitor the accesses from/to a memory chip and modifying them on the fly (Man-In-The-Middle attack).

    In particular, the following topics will be discussed:

    • Desoldering of a flash chip;
    • Conception of a breakout board with KiCAD;
    • PCB fabrication and microsoldering;
    • Addition of a breakout board on an IoT device;
    • Dump of a SPI flash;
    • Dump of a parallel flash;
    • Man-in-the-Middle attacks.

    Let's say you opened up yet-another-IoT-device and stumbled on a flash chip inside. Curious as you are, you obviously want to know what's going on inside.

    Desoldering the flash chip

    To read the content of the flash chip, there are basically two options :

    • connecting wires directly on the pins of the chip;
    • desoldering the flash and plug it on another board.

    One of the things to consider when choosing a method to read the chip is the packaging of the integrated circuit (IC). For example, connecting wires directly on the pins of the chip works well with chips using a quad flat pack (QFP) packaging, but it's less adapted if there are no visible pins. In the following case, the flash chip uses a ball grid array (BGA) packaging, which means no visible pin to fiddle with, so we choose to desolder the IC.

    Picture of our target chip:

    On the bright side:

    • Since we're extracting the flash, all possible interferences with the onboard microcontroller are avoided.
    • The chip is removed completely from the board, which gives us the ability to study the PCB underneath and find out the routing to the flash chip.
    • The original chip can be replaced with something else (another chip, a microcontroller, ...).

    On the less bright side:

    • The board cannot run without all of its components, you'll have to solder it back if you want to use it in the future.
    • Some nearby components could be damaged during the extraction.
    • The flash chip itself could be damaged if it's done improperly.

    So... desoldering flash, right? If you never tried desoldering electronic components before, the tricky part is to melt the solder on all pins at the same time. There are several techniques to do that. We choose to go with the heat gun. The goal is to heat the area where the chip is, wait for the solder to melt and remove the chip.
    This technique is simple and rapid but it tends to desolder adjacent components, so be careful not to move them (i.e. this is exactly the worst moment to sneeze).

    The picture below shows our chip out of its emplacement and we can now have a look at the PCB routing. We can already make some hypothesis, like the two bottom rows which are likely unused since they are not routed.

    Conception of a breakout board with KiCAD

    What do we do now with that chip? BGA layouts are a mess, you can have a 5x5 grid or a 4x6 grid for the exact same chip. Pinouts are equally fun, and usually specific to the chip. Another thing you might be wondering is how to access a particular pin when they are all packed together in a grid like that?

    One solution is to make a breakout board! Basically, a breakout board mirrors all the pins of the chip but with more space between them, so you can access them easily.

    To realize this, we first need to gather some information about the chip itself. Most of the time, the brand and/or model are written on the chip and help identifying it. With this information, one can look for the corresponding datasheets. If you can't identify the chip or if you can't find the datasheet, you will have to do some reverse engineering on the PCB to identify each signal.

    The brand is indicated on the first line of our chip: MXIC stands for Macronix International. The second line is the model of the chip, which leads us to the MX25L3255EXCI datasheet.

    The section that is of interest to us is the pin layout, page 7 of the datasheet. Both BGA configurations (4x6 and 5x5) are described as well as a SOP8 package. We can see that only eight pins are useful, other pins are tagged "NC" which means "no connection".

    To communicate with the flash chip, we need a PCB exporting all the required pins to some easy-to-access header.

    The design of the PCB can be realized using KiCAD, one of the most popular electronics design automation (EDA) software.

    If you are not familiar with KiCAD, many great tutorials are available like KiCAD Quick-Start Tutorial.

    The design of a breakout board follows the same process as for any other board:

    1. Create an electronic schematic for your board in eeschema, and define the components that are specific to your project, for example your flash chip.
    1. Create the specific footprint for your flash chip in pcbnew. This is where the information from the datasheet that we looked earlier is useful. We will add a 4x6 grid representing the BGA grid, and two 1x4 connectors linked to the 8 useful pins. The final step is to add routes to connect our components

    Our design is done, how do we transform a KiCAD project into a working PCB?

    PCB fabrication

    A PCB is basically a sandwich made of a layer of substrate between two layers of copper. The substrate is usually made of FR-4 (glass-reinforced epoxy laminate) but other cheaper materials can also be found. Routes are traced on the copper layer and the excess copper is then removed.

    Several techniques exist to remove the unwanted copper, we tried the following:

    Both techniques are detailed, as we used the etching technique to build the 4x6 BGA PCB and the milling technique was used to build the 5x5 BGA PCB.

    Etching

    Etching refers to the process of using a chemical component to "bite" into the unprotected surface of a metal. We use ink as a way to delimit the traces and protect the bits of copper to keep.

    1. We use the toner transfer method to reproduce the design on copper. The design is printed on a glossy sheet of paper using a laser printer. The sheet of paper is then taped to the piece of copper/fiber glass substrate, and heat and pressure are applied to get the design out of the paper onto the copper board. Usually, this technique uses a regular clothes iron to apply heat and pressure. We found out that using a laminator is way more efficient as the heat and the pressure applied are more uniform.
    2. Next step is the actual etching. The board is immersed into a chemical solution which will remove excess copper, except where the toner is.

    Our breakout board after etching, still with the transferred toner attached:

    And after removing the toner with acetone:

    The PCB board is now ready for microsoldering. Microsoldering is like soldering but with tiny components, hence it requires a microscope.

    Another difference with traditional soldering is the packaging of the solder. Traditional soldering uses solder in the form of wire while BGA microsoldering uses solder balls.

    Next, we can start reballing:

    • put a new solder ball in each slot and apply heat to melt the solder balls in place;
    • align the chip and the board;
    • reflow.

    The board being reballed:

    And the final result with the chip and the board after microsoldering:

    CNC Milling

    Alternatively, a CNC milling machine can be used to carve out bits of unwanted copper. Actually rather than removing all the unwanted copper, the CNC will simply isolate the required tracks and leave the excess of copper in place.

    1. The 5x5 BGA format was used to build a PCB. While the 4x6 version was a breakout board, we designed the 5x5 version such that it can be directly plugged in a universal EEPROM programmer ZIF socket. As we've seen in the datasheet, this chip also exists in SOP8 package, so we've chosen to mimic a DIP8 pin header reproducing the same pin layout as for the SOP8. So for the universal EEPROM programmer, this setup will be virtually the same as reading the SOP8 chip via a classic SOP8-DIP8 adapter.

    2. The footprint for the chip is somehow similar to the one we designed for the 4x6 but with a 5x5 grid, the 1x4 connectors closer, as for a DIP8, and a somehow more tortuous routing to respect the SOP8 layout which is unfortunately completely different from the BGA one.

    3. KiCAD is not able to produce directly a file compatible with a CNC, therefore we'll use Flatcam which takes a Gerber file and allows to define a path for the CNC to isolate the desired copper tracks. To avoid shortage issues, we also define an area under the BGA chip to remove entirely the unwanted copper.

    4. And we pass the produced STL file to bCNC, in charge of controlling the CNC. It has some nice features such as auto-levelling, i.e. measuring the actual height of the board in several points (because nothing is perfectly flat), and producing the heat map you can see in the snapshot below.

    Milling in action, corresponding to the tracks highlighted in green in bCNC:

    1. Board fully milled:

    Close up of the final result where we can distinguish the pattern of the flatcam geometry path under the BGA:

    6. Next, we apply some solder mask, which is the characteristic green layer protecting the copper from oxidation, and cure it with UV light.

    7. The solder mask covered the pads of the BGA and of the 1x4 connectors, they are unusable like this. We scratch manually the thin layer of paint to free the pads.

    1. Tinning step, where we apply solder on all pads:
    1. Back to the CNC to drill the holes and cut the edges of the board:
    1. Final board with the BGA chip soldered and ready to be inserted in a universal EEPROM programmer:

    As we've chosen to mimic the SOP8 pinout, we've simply to tell to the programmer that our chip is the SOP8 version!

    Bonus: the horror show

    Here is a compilation of our best failures, because things don't always go as planned, but we learned a lot through these experimentations and we are now ready for the next IoT stuff :)

    Toner transfer is not always as easy as it sounds...
    Milling on the CNC with the right depth neither...
    Failing at finding a plastic that doesn't adhere to the green mask... (eventually IKEA freezing bags revealed to work very well :) )

    Attempt to mill the green mask...

    Second attempt with a tool mounted on a spring: looks almost good but actually all tracks were cut from the pads...

    Third attempt by adding first some solder in the hope to make them thicker

    Created a lake of green mask too thick to cure with UV light, and when the surface of the icy lake breaks...

    Conclusion

    That concludes our first article where we saw how to desolder a flash, design a PCB and detailed two techniques of PCB fabrication.

    Acknowledgements

    Thanks to all Quarkslab colleagues who proofread this article and provided valuable feedback.

    Lilium, a Flying Car Start-Up, Raises $90M

    $
    0
    0

    The design, by the four graduates of the Technical University of Munich who founded Lilium, is meant to be more energy efficient than competitors’ models. As the start-up demonstrated with its Eagle in April, Lilium’s vehicle is designed to take off and land vertically, like a helicopter.

    Video by Lilium

    Lilium is also working on a bigger, five-seat version of what it calls an “air taxi” that could ferry passengers or cargo as far as 300 kilometers, or 186 miles, and reach a maximum speed of 300 kilometers an hour.

    “We have highly congested cities where we can do things to improve matters,” Remo Gerber, Lilium’s chief commercial officer, said. He and his colleagues envision a fleet of air taxis zipping across crowded cities, once the vehicles are created and approved by the various regulators, of course.

    “We’re trying to move from a niche transport vehicle to a mass-transport one,” he added.

    That has obvious appeal to Tencent: Its e-commerce empire could benefit from making such air transport a reality.

    “From underdeveloped regions with poor road infrastructure, to the developed world with traffic congestion and sprawl, new possibilities emerge when convenient daily flight becomes an option for all of us,” David Wallerstein, Tencent’s chief exploration officer, said in a statement.

    The cash infusion from Tencent and other investors will help accelerate that work, and allow Lilium to expand beyond its team of roughly 70 employees, Mr. Gerber said.

    Continue reading the main story

    Remake – GNU Make with comprehensible tracing and a debugger

    $
    0
    0
    Remake - GNU Make with comprehensible tracing and a debugger

    remake is an enahanced version of GNU Make that adds improved error reporting, better tracing, profiling and a debugger.

    The latest version is based off of the GNU Make 4.1 source. We also have a some cool debuggers for NodeJS,Python,Perl,GNU Bash, andZ-Shell.

    Source Code

    Excerpts

    Valid HTML 4.01 TransitionalValid CSS!SourceForge Logo

    How I Used Professional Poker to Become a Data Scientist

    $
    0
    0

    April 15th, 2011, is referred to as Black Friday in the poker community. It’s the day that the United States Government shut down the top three online poker sites. About 4,000 US citizens played online poker professionally back then, and thus the exodus began. Canada and Costa Rica were popular destinations. I’m from Southern California, so I’m no stranger to Baja California. I decided to set up shop south of the border in a town called Rosarito, Mexico.

    As I prepared to move down to Baja, I was often asked, “What happens if this doesn’t work out?” Playing online poker requires a solid understanding of data, probability, and statistics. Back then I knew of only one other profession that utilized a similar skill set. My response was, “I’ll probably end up working as an analyst on Wall Street.”

    That same month, the movie Moneyball was released. Based on Michael Lewis’s nonfiction book of the same name, the movie takes place during the 2002 season of the Oakland A’s. Using data analysis strategies similar to Wall Street analysts, the team at the A’s revolutionized baseball. They won a record 20 games in a row on a shoestring budget. This was the moment that data analytics went mainstream. One year later, Thomas H. Davenport and D.J. Patil published Data Scientist: The Sexiest Job of the 21st Century in the Harvard Business Review. Glassdoor.com has ranked data scientist as the top job in the US for 2016 and 2017.

    What data analysis has in common with poker

    I began transitioning to a career in data science in 2016. I’ve noticed that much of what I learned during my poker career is relevant to customer segmentation. Where a poker player is from (geographic segmentation), how the player thinks (psychographic segmentation), and how the player plays (behavioral segmentation) are all very important factors when determining a strategy against that player. I learned during my poker career that these factors could be boiled down to a couple of simple statistics. I could tell how good a player was based on just two numbers. To test this theory, I built a K-Means model to segment my poker opponents, much like a company would segment their customers.

    The data for this project was generated during my playing career. I played No-Limit Texas Hold’em cash games and the stakes ranged from $25 buy in ($0.25 Big Blind) to $200 buy in ($2 Big Blind). I usually played 15–20 tables at a time, each table having eight or nine players, which resulted in about 600 hands per hour. I have the most data at the $25 buy-in games because it’s the most popular game. I used the data at this level from 2013 where I won $1,913.13 over 387,373 hands, which was a small fraction of the hands I played that year.

    Each time a poker hand is played at an online poker site, a hand history is generated that explains everything that each player did during the hand. I used software called Hold’em Manager (think Tableau for poker), which downloads each of these hand histories in real time to a PostgreSQL database so you can keep track of your opponent’s tendencies. These tendencies are visualized as a Heads-Up-Display at the poker table and it looks like this:

    How I used data analytics to outmaneuver my opponents

    In Texas Hold’em, each player is dealt two cards at the beginning of the hand which means there are 1326 starting hand combinations you can be dealt. For those who aren’t familiar with how Texas Hold’em is played, click here for a full explanation. As a hand progresses, it’s necessary to make assumptions about the range of hands your opponent may be holding. Having statistics on an opponent’s tendencies is powerful because it makes it very easy to accurately assume your opponent’s range. For example, some players rarely raise Pre-Flop so their Pre-Flop Raise (PFR) percent is low. If an opponent has a 2% PFR, I know they only have about 26 of the 1326 starting hand combinations in their range. Since they are likely to raise with the best hands, and AA, KK, and AK have 28 combinations, I have a solid idea of what they have.

    [During each poker session, I would mark any hand that confused me and go back and review it at the end of the day. For an in-depth look at how to use probability and statistics to maximize expected value using actual hands, and actual opponent statistics, click here.]

    The two statistics that I focused on to determine if an opponent was a good player or not were PFR percent, mentioned above, and ‘Voluntarily Put Money in Pot’ (VP$IP) percentage. VP$IP percent is the frequency with which a player plays a hand when first given an opportunity to bet or fold. Those two stats, and the ratio between the two, gave me most of the information I needed to determine if a player was a winner (a Shark) or a loser (a Fish).

    The Pareto Principle, named after economist Vilfredo Pareto, states that for many events, roughly 80% of the effects come from 20% of the causes. This suggests that 80% of a company’s profits are likely generated from about 20% of their customers, and 80% of my profits were likely generated from about 20% of my opponents.

    I identified the 20% of my opponents who I had the highest win rate against (Fish), and the 20% who I had the highest loss rate against (Sharks). I built a K-means model with five clusters to segment my opponents, using eight statistics that measure important playing tendencies as variables. Once segmented, I identified the segment with the highest concentration of Fish, and the one with the highest concentration of Sharks. For each segment, I averaged the opponent’s VP$IP percent and PFR percent. My hypothesis was that the Sharks would have a VP$IP and PFR most similar to my VP$IP and PFR, and the Fish would have the highest VP$IP and biggest difference between the two stats.

    The Shark

    VP$IP = 15.1
    PFR = 11.7%

    In the Shark segment, opponents on average have a VP$IP of 15.1% and a PFR of 11.7%. The image on the top approximates what a 15.1% VP$IP range looks like, and the image on the bottom approximates an 11.7% PFR range. The hands highlighted in yellow are the hands these players typically play. As you can see, these images are similar and consist mainly of good starting hands. These players fundamentally understand two things.

    1. There is no reason to put money in the pot if you don’t have a good starting hand so it’s better to fold.
    2. When you do have a good starting hand, it is better to play aggressive and raise. The fundamental reason why playing aggressive poker is more profitable than passive poker is because betting and raising give you two ways to win; having the best hand or causing your opponents to fold. Your opponents can’t fold if you don’t bet.

    These opponents cost me money at the poker table, but how might this look for a company? Let’s say we’re an online retailer selling widgets. We can probably learn a lot about our potential customers by how many pages of our website they’ve viewed along with the specific pages they’ve viewed. How each person interacts with the website will show a pattern of behavior. A segment that views a limited number of pages, and mostly pages that sell low-profit margin widgets may indicate a pattern of behavior that consistently results in low or no profit customers. Once identified, we can avoid allocating resources to these potential customers.

    The Fish

    VP$IP = 43.8%
    PFR = 14.0%

    In the Fish segment, opponents on average have a VP$IP of 43.8% which is approximated by the image on the top and a PFR of 14%, approximated by the image on the bottom. These images are not similar. These players are voluntarily putting money in the pot almost three times as often as Sharks. This indicates they are frequently playing with mediocre or even bad starting hands, and what’s worse is they’re playing them passively. Playing bad hands passively costs money at the poker table, and that money goes into my pocket. I never sat at a poker table that didn’t have at least two Fish playing.

    Let’s go back to our online widget retailer analogy. What might their highest value segment look like? This segment probably views a high number of web pages, and spends time on pages that sell the widgets with the highest profit margins. High value customers might be arriving through certain landing pages, or might gravitate to certain blog posts. It could even be as simple as the time spent on the website. Once a potential customer is identified as being part of this high value segment, we’d want to allocate resources to convert them into customers, such as adding them to a targeted marketing campaign or having a salesperson reach out.

    Making a Raspberry Pi-Powered AI to Play Piano

    $
    0
    0

    I was inspired by Dan Tepfer's piano worlds to explore my own universe of augmented piano playing. Could I write a program that learns in realtime to improvise with my style in the music breaks between my own playing? 🤖🎹

    This is pretty much a play-by-play on making PianoAI. If you just want to try out PianoAI, go to the Github for instructions and downloading. Otherwise, stay here to read about my many programming follies.

    After watching Dan Tepfers's video on NPR, I did some freeze frames of his computer and found out he uses the Processing software to connect up to his (very fancy) MIDI keyboard. I pretty easily managed to get together something very similar with my own (not fancy) MIDI keyboard.

    Freeze frame of Dan Tepfer showing his software for making automated music

    As explained in the video, Dan's augmented piano playing basically allows you to mirror or echo certain notes in specified patterns. A lot of his patterns seem to be song dependent. After thinking, I decided I was interested in something a little different. I wanted to a piano accompainment that learns in realtime to emulate my style and improvise in the spaces between my own playing, on any song.

    I'm not the first to make a Piano AI. Google made the A.I. Duet which is a great program. But I wanted to see if I could make an A.I. specfically specfically tuned to my own style.

    My equipment is nothing special. I bought it used from some guy who decided he had to give up trying to learn how to play piano 😢. Pretty much any MIDI keyboard and MIDI adapter will do.

    I generally need to do everything at least twice in order to get it right. Also I need to draw everything out clearly in order to actually understand what I'm doing. My process for writing programs then is basically as follows:

    1. Draw it out on paper.
    2. Program it on in Python.
    3. Start over.
    4. Draw it out on paper, again.
    5. Program it in Go.

    First two pages of 12 for figuring out what I'm doing

    Each time I draw out my idea on paper, it takes about three pieces of paper before my idea actually starts to take form and possibly work.

    Programming a Piano AI in Python

    Playing piano with Python

    Once I had an idea of what I was doing, I implemented everything in a set of Python scripts. These scripts are built on pygame which has great support for MIDI. The idea is fairly simple - there are two threads: a metronome and a listener. The listener just records notes played by the host. The metronome ticks along and plays any notes in the queue, or asks the AI to send some new notes if none are in the queue.

    I made it somewhat pluggable, as you can do variations on the AI so it can be easily outfitted with different piano augmentations. There is an algorithm for simply echoing, one for playing notes within the chord structure (after it determines the chords), and one for generating piano runs from a Markov chain. Here's a movie of me playing with the latter version of this algorithm (when my right hand moves away from the keyboard, the AI begins to play until I play again):

    My first piano-playing AI

    There were a couple of things I didn't like about this. First, its not very good. At best, the piano AI accompaninment sounds like a small child trying hard to emulate my own playing (I think there are a couple of reasons for this - basically not taking into account velocity data and transition times). Secondly, these python scripts did not work on a Raspberry Pi (the video was shot with me using Windows)! I don't know why. I had trouble on Python3.4, so I upgraded to 3.6. With Python3.6, I still had weird problems. pygame.fastevent.post worked but pygame.fastevent.get did not. I threw up my hands at this and found an alternative.

    The alternative is to write this in Go. Go is notably faster than Python - which is quite useful since this is a low-latency application. My ears discern discrepencies of > 20 milliseconds, so I want to keep processing times down to a minimum. I found a Go midi library so porting was very viable.

    Programming a Piano AI in Go

    Playing piano with Go

    I decided to simplify a little bit, and instead of making many modules with different algorithms, I would focus on the one I'm most interested: a program that learns in realtime to improvise in the spaces between my own playing. I took out some more sheets of paper and began.

    Day 1

    Most of the code is about the same with my previous Python scripts. When writing in Go, I found that spawning threads is so much easier than in Python. Threads are all over this program. There are threads for listening to midi, threads for playing notes, threads for keeping track of notes. I was tempted to use the brand new Go 1.9 sync.Map in my threads, but realized I could leverage maps of maps which is beyond the sync.Map complexity. Still, I just made a map of maps that is very similar to another sync map store that I wrote (schollz/jsonstore).

    I attempted to make everything classy (pun-intended) so I implemented components (midi, music, ai) as their own objects with their own functions. So far, the midi listening works great, and seems to responds very fast. I also implemented play back functions and they work too - this is pretty easy.

    Day 2

    Started by refactoring all the code into folders because I'd like to reserve the New function for each of the objects. The objects have solidified - there is a AI for learning / generating licks, a Music object for the piano note models, a Piano object for communicating with midi, and a Player object for pulling everything together.

    I spent a lot of time with pen and paper figuring out how the AI should work. I realized that there is more than one way to make a Markov chain out of Piano notes. Piano notes have four basic properties: pitch, velocity, duration, and lag (time to next note). The basic Markov chain for piano notes would be four different Markov chains, one for each of the properties. It would be illustrated as such:

    Basic Markov chain for piano properties

    Here the next pitch for the next note (P2) is determined from the pitch of the previous note (P1). Similar for Velocity (V1/V2), Duration (D1/D2) and Lag (L1/L2). The actual Markov chain simply enumerates the relative frequencies of occurence of the value of each property and uses a random selector to pick one.

    However, the piano properties are not nessecarily indepenent: sometimes there is a relationship between the pitch and velocity, or the velocity and the duration of a note. To account for this I've allowed for different couplings. You can couple properties to the current or the last value of any other property. Currently I'm only allowing two couplings, because that's complicated enough. But in theory, you could couple the value of the next pitch to the previous pitch and velocity and duration and lag!

    Once I had everything figured out, theoretically, I began to implement the AI. The AI is simply a Markov chain, so it determines a table of relative frequencies of note properties and has a function for computing them from the cumulative probabilties and a random number. At the end of the night, it works! Well, kinda but not really. Here's a silly video of me playing a lick to it and getting some AI piano runs:

    Example of the basic Markov chain for accompaniment

    Seems like there is more improvement to be made tomorrow!

    Day 3

    There is no improvement to be made that I can find.

    But maybe the coupling I tried yesterday is not very good. The coupling I'm most interested can be visualized as:

    Markov chain for piano properties, with lots of coupling

    In this coupling, the previous pitch determines the next pitch. The next velocity is determined by the previous velocity and the current pitch. The current pitch also determines the duration. And the current duration determines the current lag. This needs to be evaluated in the correct order (pitch, duration, velocity, lag) and that's left up to to user cause I don't want to program in tree traversals.

    Well, I tried this and it sounds pretty bad. I'm massively disappointed in the results. I think I need to try a different machine learning. I'm going to make my repo public now, maybe someone will find it and take over for me because I'm not sure I will continue on it.

    Day 4

    I've been thinking, and I'm going to try a neural net. (commit b5931ff6).

    I just tried a neural net. It went badly, to say the least. I tried several variations too. I tried feeding in the notes as pairs, either each property individually or all the properties as a vector. This didn't sound good - the timings were way off and the notes were all over the place.

    I also tried a neural net where I send the layout of the whole keyboard (commit 20948dfb) and then the keyboard layout that it should transition into. It sounds complicated because I think it is and it didn't seem to work either.

    The biggest problem I noticed with the neural net is that it is hard to get some randomness. I tried introducing a random column as a random vector but it just creates too many spurious notes. Once the AI piano lick begins, it seems to just get stuck in a local minimum and doesn't explore much anymore. I think in order to make the neural net work, I'd have to do what Google does and try to Deep learn what "melody" is and what a "chord" is and what a "piano" is. Ugh.

    Day 5

    I give up.

    I did give up. But then, I couldn't help but rethink the entire project while running in the forest.

    Sometimes you just have to look at some trees.

    What is an AI really? Is it just supposed to play with my level of intelligence? What is my level of intelligence when I play? When I think about my own intelligence, I realize: I'm not very intelligent!

    Yes, I'm a simple piano player. I just play notes in scales that belong to the chords. I have some little riffs that I mix in when I feel like it. Actually, the more I think about it I realize that my piano improvisation is like linking up little riffs that I reuse or copy or splice over and over. So the Piano AI should do just that!

    Another, smaller, piece of paper for thinking.

    I wrote down the idea on the requisite piece of paper and went home to program it. Basically this version of the AI was a Markovian scheme again but greater than first order (i.e. remembering more than just the last note). And the Markov transitions should link up larger segments of notes that are known to be riffs (i.e. based off my playing history). I implemented a new AI for this (commit bc96f512) and tried it out.

    Day 6

    What the heck! Someone put my Piano AI on Product Hunt today. Oh boy, I'm not done, but I'm almost done so I hope no one tries it today.

    I like being on ProductHunt, but I wish I had finished first

    With a fresh brain I found a number of problems that were actually pretty easy to fix. I fixed:

    And I add command-line flags so its ready to go. And it actually works! Here's some videos of me teaching for about 30 seconds and then jamming:

    Clip #1

    Clip #2

    Clip #3

    This is likely not the last day, but if you have more ideas or questions, let me know! Tweet @yakczar.

    A Bigger Mathematical Picture for Computer Graphics

    $
    0
    0

    Offentliggjort den 30. jul. 2017

    Slideshow & audio of Eric Lengyel’s keynote in the 2012 WSCG conference in Plzeň, Czechia, on geometric algebra for computer graphics.

    Short abstract: This talk introduces the basic concepts of the exterior algebra (aka geometric algebra or Clifford algebra) and presents a bigger mathematical picture that enables a deeper understanding of computer graphics concepts such as homogeneous coordinates for representing points, lines, and planes, the operations that can be performed among them using the progressive and regressive products, and incomplete pieces of the bigger picture, such as Plücker coordinates.

    Full abstract: http://wscg.zcu.cz/wscg2012/tutorial/...

    Slides (pdf): http://www.terathon.com/wscg12_lengye...

    About the author: http://www.terathon.com/lengyel/

    About geometric algebra: https://en.wikipedia.org/wiki/Geometr...

    Some photos of the keynote: http://imgur.com/a/JrPRX

    Show HN: Key Values – Find engineering teams that share your values

    $
    0
    0

    Good Eggs

    Good Eggs

    Local, Organic Groceries Delivered

    • 1.

      Bonded by Love for Product

    • 2.

      Uses Agile Methodologies

    • 3.

      Eats Lunch Together

    • 4.

      Work/Life Balance

    • 5.

      Continuous Delivery

    • 6.

      Start-to-Finish Ownership

    • 7.

      Fosters Psychological Safety

    • 8.

      High Quality Code Base

    • B2C

    • Technical Founder(s)

    • PBC / B-Corp

    Viewing all 25817 articles
    Browse latest View live


    <script src="https://jsc.adskeeper.com/r/s/rssing.com.1596347.js" async> </script>