We've read so many sad stories about communities that were fatally compromised or destroyed due to security exploits. We took that lesson to heart when we founded the Discourse project; we endeavor to build open source software that is secure and safe for communities by default, even if there are thousands, or millions, of them out there.
However, we also value portability, the ability to get your data into and out of Discourse at will. This is why Discourse, unlike other forum software, defaults to a Creative Commons license. As a basic user on any Discourse you can easily export and download all your posts right from your user page.
As a site owner, you can easily back up and restore your entire site database from the admin panel, right in your web browser. Automated weekly backups are set up for you out of the box, too. I'm not the world's foremost expert on backups for nothing, man!
Over the years, we've learned that balancing security and data portability can be tricky. You bet your sweet ASCII a full database download is what hackers start working toward the minute they gain any kind of foothold in your system. It's the ultimate prize.
To mitigate this threat, we've slowly tightened restrictions around Discourse backups in various ways:
Administrators have a minimum password length of 15 characters.
Both backup creation and backup download administrator actions are formally logged.
Backup download tokens are single use and emailed to the address of the administrator, to confirm that user has full control over the email address.
The name of the security game is defense in depth, so all these hardening steps help … but we still need to assume that Internet Bad Guys will somehow get a copy of your database. And then what? Well, what's in the database?
Identity cookies
Cookies are, of course, how the browser can tell who you are. Cookies are usually stored as hashes, rather than the actual cookie value, so having the hash doesn't let you impersonate the target user. Furthermore, most modern web frameworks rapidly cycle cookies, so they are only valid for a brief 10 to 15 minute window anyway.
Email addresses
Although users have reason to be concerned about their emails being exposed, very few people treat their email address as anything particularly precious these days.
All posts and topic content
Let's assume for the sake of argument that this is a fully public site and nobody was posting anything particularly sensitive there. So we're not worried, at least for now, about trade secrets or other privileged information being revealed, since they were all public posts anyway. If we were, that's a whole other blog post I can write at a later date.
Now that the attacker has your database, they can crack your password hashes with large scale offline attacks, using the full resources of any cloud they can afford. And once they've cracked a particular password hash, they can log in as that user … forever. Or at least until that user changes their password.
⚠️ That's why, if you know (or even suspect!) your database was exposed, the very first thing you should do is reset everyone's password.
But what if you don't know? Should you preemptively reset everyone's password every 30 days, like the world's worst bigco IT departments? That's downright user hostile, and leads to serious pathologies of its own. But the reality is that you probably won't know when your database has been exposed, at least not until it's too late to do anything about it. So it's crucial to slow the attackers down, to give yourself time to deal with it and respond.
Thus, the only real protection you can offer your users is just how resistant to attack your stored password hashes are. There are two factors that go into password hash strength:
The hashing algorithm. As slow as possible, and ideally designed to be especially slow on GPUs for reasons that will become painfully obvious about 5 paragraphs from now.
The work factor or number of iterations. Set this as high as possible, without opening yourself up to a possible denial of service attack.
I've seen guidance that said you should set the overall work factor high enough that hashing a password takes at least 8ms on the target platform. It turns out Sam Saffron, one of my Discourse co-founders, made a good call back in 2013 when he selected the NIST recommendation of PBKDF2-HMAC-SHA256 and 64k iterations. We measured, and that indeed takes roughly 8ms using our existing Ruby login code on our current (fairly high end, Skylake 4.0 Ghz) servers.
But that was 4 years ago. Exactly how secure are our password hashes in the database today? Or 4 years from now, or 10 years from now? We're building open source software for the long haul, and we need to be sure we are making reasonable decisions that protect everyone. So in the spirit of designing for evil, it's time to put on our Darth Helmet and play the bad guy – let's crack our own hashes!
We're gonna use the biggest, baddest single GPU out there at the moment, the 1080 GTX Ti. As a point of reference, for PBKDF2-HMAC-SHA256 the 1080 achieves 1180 kH/s, whereas the 1080 Ti achieves 1640 kH/s. In a single video card generation the attack hash rate has increased nearly 40 percent. Ponder that.
First, a tiny hello world test to see if things are working. I downloaded hashcat. I logged into our demo at try.discourse.org and created a new account with the password 0234567890; I checked the database, and this generated the following values in the hash and salt database columns for that new user:
hash 93LlpbKZKficWfV9jjQNOSp39MT0pDPtYx7/gBLl5jw= salt ZWVhZWQ4YjZmODU4Mzc0M2E2ZDRlNjBkNjY3YzE2ODA=
Hashcat requires the following input file format: one line per hash, with the hash type, number of iterations, salt and hash (base64 encoded) separated by colons:
type   iter  salt                                         hash
sha256:64000:ZWVhZWQ4YjZmODU4Mzc0M2E2ZDRlNjBkNjY3YzE2ODA=:93LlpbKZKficWfV9jjQNOSp39MT0pDPtYx7/gBLl5jw=
Let's hashcat it up and see if it works:
./h64 -a 3 -m 10900 .\one-hash.txt 0234567?d?d?d
Note that this is an intentionally tiny amount of work, it's only guessing three digits. And sure enough, we cracked it fast! See the password there on the end? We got it.
Now that we know it works, let's get down to business. But we'll start easy. How long does it take to brute force attack the easiest possible Discourse password, 8 numbers– that's "only" 810 combinations, a little over one billion.
Even with a top of the line GPU that's … OK, I guess. Remember this is just one hash we're testing against, so you'd need one hour per row (user) in the table. And I have more bad news for you: Discourse hasn't allowed 8 character passwords for quite some time now. How long does it take if we try longer numeric passwords?
But all digit passwords are easy mode, for babies! How about some real passwords that use at least lowercase letters, or lowercase + uppercase + digits?
Guess.Mask.......: ?l?l?l?l?l?l?l?l [8]
Time.Estimated...: Mon Sep 04 10:06:00 2017 (94 days, 10 hours)

Guess.Mask.......: ?1?1?1?1?1?1?1?1 [8] (-1 = ?l?u?d)
Time.Estimated...: Sun Aug 02 09:29:48 2020 (3 years, 61 days)
A brute force try-every-single-letter-and-number attack is not looking so hot for us at this point, even with a high end GPU. But what if we divided the number by eight… by putting eight video cards in a single machine? That's well within the reach of a small business budget or a wealthy individual. But dividing 38 months by 8 isn't such a dramatic reduction in the time to attack. Instead, let's talk about nation state attacks where they have the budget to throw thousands of these GPUs at the problem (1.1 days), maybe even tens of thousands (2.7 hours), then … yes. Even allowing for 10 character password minimums, you are in serious trouble at that point.
If we want Discourse to be nation state attack resistant, clearly we'll need to do better. Hashcat has a handy benchmark mode, and here's a sorted list of the strongest (slowest) hashes that Hashcat knows about benchmarked on a rig with 8 Nvidia GTX 1080 GPUs. Of the things I recognize on that list, bcrypt, scrypt and PBKDF2-HMAC-SHA512 stand out.
My quick hashcat results gave me some confidence that we weren't doing anything terribly wrong with the Discourse password hashes stored in the database. But I wanted to be completely sure, so I hired someone with a background in security and penetration testing to, under a signed NDA, try cracking the password hashes of two live and very popular Discourse sites we currently host.
I was provided two sets of password hashes from two different Discourse communities, containing 5,909 and 6,088 hashes respectively. Both used the PBKDF2-HMAC-SHA256 algorithm with a work factor of 64k. Using hashcat, my Nvidia 1080 Ti GPU generated these hashes at a rate of ~27,000/sec.
Common to all discourse communities are various password requirements:
All users must have a minimum password length of 10 characters.
All administrators must have a minimum password length of 15 characters.
Users cannot use any password matching a blacklist of the 10,000 most commonly used passwords.
Users can choose to create a username and password or use various third party authentication mechanisms (Google, Facebook, Twitter, etc). If this option is selected, a secure random 32 character password is autogenerated. It is not possible to know whether any given password is human entered, or autogenerated.
Using common password lists and masks, I cracked 39 of the 11,997 hashes in about three weeks, 25 from the ████████ community and 14 from the ████████ community.
This is a security researcher who commonly runs these kinds of audits, so all of the attacks used wordlists, along with known effective patterns and masks derived from the researcher's previous password cracking experience, instead of raw brute force. That recovered the following passwords (and one duplicate):
If we multiply this effort by 8, and double the amount of time allowed, it's conceivable that a very motivated attacker, or one with a sophisticated set of wordlists and masks, could eventually recover 39 × 16 = 624 passwords, or about five percent of the total users. That's reasonable, but higher than I would like. We absolutely plan to add a hash type table in future versions of Discourse, so we can switch to an even more secure (read: much slower) password hashing scheme in the next year or two.
After this exercise, I now have a much deeper understanding of our worst case security scenario, a database compromise combined with a professional offline password hashing attack. I can also more confidently recommend and stand behind our engineering work in making Discourse secure for everyone. So if, like me, you're not entirely sure you are doing things securely, it's time to put those assumptions to the test. Don't wait around for hackers to attack you — hacker, hack thyself!
[advertisement] At Stack Overflow, we put developers first. We already help you find answers to your tough coding questions; now let us help you find your next job.
I went to Antarctica in December 2014. These rare shots capture the seldom-seen underside of an iceberg. For press inquires or print media requests, please use my contact page. More shots on Instagram.
Follow me here to be notified of behind-the-scenes video, gear tutorials, and project updates.
Video of the experience at the bottom of this page.
Microsoft Cognitive Toolkit version 2.0 is now in full release with general availability. Cognitive Toolkit enables enterprise-ready, production-grade AI by allowing users to create, train, and evaluate their own neural networks that can then scale efficiently across multiple GPUs and multiple machines on massive data sets.
The 2.0 version of the toolkit, previously known as CNTK, started in beta on October 2016, went to release candidate April 3, and is now available for production workloads. Upgrades include a preview of Keras support natively running on Cognitive Toolkit, Java bindings and Spark support for model evaluation, and model compression to increase the speed to evaluating a trained model on CPUs, along with performance improvements making it the fastest deep learning framework.
On multiple GPUs, the performance gets even better with scale. For example, with the very latest Volta GPU from NVIDIA, the V100, see how the performance projections get progressively better with up to 64 V100’s.
As a part of this general availability release, we are excited to highlight three new features below.
Keras Support (public preview): The Keras API was designed for users to develop AI applications and is optimized for the user experience. Keras follows best practices for reducing cognitive load: it offers consistent and simple APIs, it minimizes the number of user actions required for common use cases, and it provides clear and actionable feedback upon user error. Keras has opened deep learning to thousands of people with no prior machine learning experience. We are delighted to announce that many thousands of Keras users are now able to benefit from the performance of Cognitive Toolkit without any changes to their existing Keras recipes. Keras support is currently in public preview as we continue to refine this capability.
Java Bindings and Spark Support: After training a model using either Python or BrainScript, Cognitive Toolkit had always provided many ways to evaluate the model in either Python, BrainScript, or C#. Now with the GA release, users can evaluate Cognitive toolkit models with a new Java API. This makes it ideal for users wishing to integrate deep learning models into their Java based applications or for evaluation at scale on platforms like Spark.
Model Compression: Evaluating a trained model on lower end CPUs found in mobile products can make real time performance difficult to achieve. This is especially true attempting to evaluate models trained for image learning on real time video coming from a camera. With the Cognitive Toolkit GA, we are including extensions that allow quantized implementations of several FP operations, which are several times faster compared to full precision counterparts. The speedup is great enough to enable evaluating Cognitive Toolkit models much faster on server and low-power embedded devices with little loss of evaluation accuracy.
Cognitive Toolkit is being used extensively by a wide variety of Microsoft products, by companies worldwide with a need to deploy deep learning at scale, and by students interested in the very latest algorithms and techniques. We’ve compiled a set of reasons why data scientists and developers who are using other frameworks now should try Cognitive Toolkit.
A week ago a new train station, named “Cambridge North”, opened in Cambridge, UK. Normally such an event would be far outside my sphere of awareness. (I think I last took a train to Cambridge in 1975.) But last week people started sending me pictures of the new train station, wondering if I could identify the pattern on it:
The system evolves line by line from the top, determining the color of each cell according to the rule underneath. This particular cellular automata I called “rule 182”, because the bit pattern in the rule corresponds to the number 182 in binary. There are altogether 256 possible cellular automata like this, and this is what all of them do:
Many of them show fairly simple behavior. But the huge surprise I got when I first ran all these cellular automata in the early 1980s is that even though all the rules are very simple to state, some of them generate very complex behavior. The first in the list that does that—and still my favorite example—is rule 30:
And, yes, it’s remarkable that starting from one black cell at the top, and just repeatedly following a simple rule, it’s possible to get all this complexity. I think it’s actually an example of a hugely important phenomenon, that’s central to how complexity gets made in nature, as well as to how we can get a new level of technology. And in fact, I think it’s important enough that I spent more than a decade writing a 1200-page book (that just celebrated its 15th anniversary) based on it.
And for years I’ve actually had rule 30 on my business cards:
But back to the Cambridge North train station. Its pattern is obviously not completely random. But if it was made by a rule, what kind of rule? Could it be a cellular automaton?
I zoomed in on a photograph of the pattern:
Suddenly, something seemed awfully familiar: the triangles, the stripes, the L shapes. Wait a minute… it couldn’t actually be my favorite rule of all time, rule 30?
Clearly the pattern is tipped 45° from how I’d usually display a cellular automaton. And there are black triangles in the photograph, not white ones like in rule 30. But if one black-white inverts the rule (so it’s now rule 135), one gets this:
And, yes, it’s the same kind of pattern as in the photograph! But if it’s rule 30 (or rule 135) what’s its initial condition? Rule 30 can actually be used as a cryptosystem—because it can be hard (maybe even NP complete) to reconstruct its initial condition.
But, OK, if it’s my favorite rule, I wondered if maybe it’s also my favorite initial condition—a single black cell. And, yes, it is! The train station pattern comes exactly from the (inverted) right-hand edge of my favorite rule 30 pattern!
It’s a little trickier to pull out precisely the section of the pattern that’s used. Here’s the code (the PlotRange is what determines the part of the pattern that’s shown):
OK, so where is this pattern actually used at the train station? Everywhere!
It’s made of perforated aluminum. You can actually look through it, reminiscent of an old latticed window. From inside, the pattern is left-right reversed—so if it’s rule 135 from outside, it’s rule 149 from inside. And at night, the pattern is black-white inverted, because there’s light coming from inside—so from the outside it’s “rule 135 by day, and rule 30 at night”.
What are some facts about the rule 30 pattern? It’s extremely hard to rigorously prove things about it (and that’s interesting in itself—and closely related to the fundamental phenomenon of computational irreducibility). But, for example—like, say, the digits of π—many aspects of it seem random. And, for instance, black and white squares appear to occur with equal frequency—meaning that at the train station the panels let in about 50% of the outside light.
If one looks at sequences of n cells, it seems that all 2n configurations will occur on average with equal frequency. But not everything is random. And so, for example, if one looks at 3×2 blocks of cells, only 24 of the 32 possible ones ever occur. (Maybe some people waiting for trains will figure out which blocks are missing…)
When we look at the pattern, our visual system particularly picks out the black triangles. And, yes, it seems as if triangles of any size can ultimately occur, albeit with frequency decreasing exponentially with size.
At the train station, there are lots of identical panels. But rule 30 is actually an inexhaustible source of new patterns. So what would happen if one just continued the evolution, and rendered it on successive panels? Here’s the result. It’s a pity about the hint of periodicity on the right-hand edge, and the big triangle on panel 5 (which might be a safety problem at the train station).
Fifteen more steps in from the edge, there’s no hint of that anymore:
What about other initial conditions? If the initial conditions repeat, then so will the pattern. But otherwise, so far as one can tell, the pattern will look essentially the same as with a single-cell initial condition.
One can try other rules too. Here are a few from the same simplest 256-rule set as rule 30:
Moving deeper from the edge the results look a little different (for aficionados, rule 89 is a transformed version of rule 45, rule 182 of rule 90, and rule 193 of rule 110):
And starting from random initial conditions, rather than a single black cell, things again look different:
And here are a few more rules, started from random initial conditions:
Here’s a website (made in a couple of minutes with a tiny piece of Wolfram Language code) that lets you experiment (including with larger rule numbers, based on longer-range rules). (And if you want to explore more systematically, here’s a Wolfram Notebook to try.)
It’s amazing what’s out there in the computational universe of possible programs. There’s an infinite range of possible patterns. But it’s cool that the Cambridge North train station uses my all-time favorite discovery in the computational universe—rule 30! And it looks great!
The Bigger Picture
There’s something curiously timeless about algorithmically generated forms. A dodecahedron from ancient Egypt still looks crisp and modern today. As do periodic tilings—or nested forms—even from centuries ago:
But can one generate richer forms algorithmically? Before I discovered rule 30, I’d always assumed that any form generated from simple rules would always somehow end up being obviously simple. But rule 30 was a big shock to my intuition—and from it I realized that actually in the computational universe of all possible rules, it’s actually very easy to get rich and complex behavior, even from simple underlying rules.
And what’s more, the patterns that are generated often have remarkable visual interest. Here are a few produced by cellular automata (now with 3 possible colors for each cell, rather than 2):
There’s an amazing diversity of forms. And, yes, they’re often complicated. But because they’re based on simple underlying rules, they always have a certain logic to them: in a sense each of them tells a definite “algorithmic story”.
One thing that’s notable about forms we see in the computational universe is that they often look a lot like forms we see in nature. And I don’t think that’s a coincidence. Instead, I think what’s going on is that rules in the computational universe capture the essence of laws that govern lots of systems in nature—whether in physics, biology or wherever. And maybe there’s a certain familiarity or comfort associated with forms in the computational universe that comes from their similarity to forms we’re used to in nature.
But is what we get from the computational universe art? When we pick out something like rule 30 for a particular purpose, what we’re doing is conceptually a bit like photography: we’re not creating the underlying forms, but we are selecting the ones we choose to use.
In the computational universe, though, we can be more systematic. Given some aesthetic criterion, we can automatically search through perhaps even millions or billions of possible rules to find optimal ones: in a sense automatically “discovering art” in the computational universe.
We did an experiment on this for music back in 2007: WolframTones. And what’s remarkable is that even by sampling fairly small numbers of rules (cellular automata, as it happens), we’re able to produce all sorts of interesting short pieces of music—that often seem remarkably “creative” and “inventive”.
From a practical point of view, automatic discovery in the computational universe is important because it allows for mass customization. It makes it easy to be “original” (and “creative”)—and to find something different every time, or to fit constraints that have never been seen before (say, a pattern in a complicated geometric region).
The Cambridge North train station uses a particular rule from the computational universe to make what amounts to an ornamental pattern. But one can also use rules from the computational universe for other things in architecture. And one can even imagine a building in which everything—from overall massing down to details of moldings—is completely determined by something close to a single rule.
One might assume that such a building would somehow be minimalist and sterile. But the remarkable fact is that this doesn’t have to be true—and that instead there are plenty of rich, almost “organic” forms to be “mined” from the computational universe.
Ever since I started writing about one-dimensional cellular automata back in the early 1980s, there’s been all sorts of interesting art done with them. Lots of different rules have been used. Sometimes they’ve been what I called “class 4” rules that have a particularly organic look. But often it’s been other rules—and rule 30 has certainly made its share of appearances—whether it’s on floors, shirts, tea cosies, kinetic installations, or, recently, mass-customized scarves (with the knitting machine actually running the cellular automaton):
This blog post is about an interesting bug which helped to reveal limitations of the Go programming language runtime.
One day Alfonso from the Weave Scope team reported a mysterious bug in Weave Net: sometimes weave ps fails to list containers connected to the “weave” bridge with Cannot find weave bridge: Link not found. In other words, weave ps was not able to get information about the “weave” bridge network interface as it could not be found. Full bug report can be found here.
Background
Before going down the rabbit hole, a bit of context. Each container in Weave network is attached via virtual ethernet interface pair, or veth, to an L2 Linux software bridge on the same host which runs containers. An example of such configuration is shown below:
To list IPv4 addresses of local containers in the weave network, one can run weave ps which runs weaveutil in an external process. The latter is implemented in Go and in a simplified way does the following:
The containerAddr function retrieves the list of all network interfaces attached to the Weave bridge and enters the given container namespace to filter container network interfaces which are attached to the bridge.
The failure happened at the line 15 which tries to get an information about the bridge via netlink.
The actual implementation of the affected version can be found here.
Unsuccessful Debugging
Luckily after a bit of experimentation, I was able to quite reliable reproduce the bug by creating 100 dummy Docker containers and issuing weave ps multiple times:
$ for i in $(seq 1 100); do docker $(weave config) run -td alpine /bin/sh; done<..>
$ for i in $(seq 1 10); do weave ps >/dev/null; done
Cannot find weave bridge: Link not found
First thing to check was whether the weave bridge interface under some circumstances did not actually exist, maybe it had been removed. However, inspecting the kernel log with dmesg showed that it did not happen.
Next, the querying of network interfaces is handled by the Go netlink library which, as the name suggests, communicates with the kernel via netlink interface. So the next step was to check for bugs in the library. Unfortunately, tracing communication between the kernel and weaveutill via netlink socket with the handy nltrace tool revealed nothing interesting, as the netlink request was valid, and the kernel returned that the “weave” interface was not found.
Revelation
The search for the cause was narrowed down to the implementation of weaveutil. As double checking the source code did not bring any success, I decided with the help of strace to see what happens in weaveutil from the Go runtime perspective (full log):
First, a goroutine entered a network namespace (lines 1-5 in the strace log) of a container, which corresponds to lines 22-26 of the Go code above.
Next, it received a list of the container network interfaces via netlink (lines 6-16), line 27 in the Go code.
After recvfrom returned, the runtime created a new OS thread, PID 3365 (lines 17-18).
Go implements concurrency by multiplexing goroutines onto OS threads. So, to prevent from stalling a system when a goroutine issues a blocking syscall, the Go runtime might create a thread before entering or exiting the syscall. This was the case for clone(2) above.
However, the runtime does not not pass the CLONE_NEWNET flag to clone. Therefore, the newly spawned thread ran in the same network namespace as the parent (PID 3361) did.
As the parent returned to the host network namespace after clone took place (lines 19-20), the child ended up running in the container namespace.
At some point the child was scheduled to run a goroutine which executed containerAddr function (lines 21-23 in the strace log). Because the weave bridge belonged to the host network namespace, and the child was in the container network namespace, obviously the bridge could not be found. This caused the error of the bug report.
Conclusions
This finding raised a question whether we can safely change a namespace in Go. Unfortunately, the answer is no, as we do not have almost any control on scheduling goroutines.
One could argue that locking a goroutine with runtime.LockOSThread could help, but a) the goroutine might spawn a new goroutine which would run in a wrong namespace b) locking does not prevent the runtime from creating a new OS thread for scheduling.
In addition, it is not possible to guarantee that a new OS process implemented in Go and started from Go with os/exec will run in a given namespace. See discussion for further details.
Having all the limitation in mind, the fix to our problem is to execute every function which requires changing a namespace in a separate OS process. Execution happens via nsenter wrapper to make sure that all runtime threads are in the same namespace. Unfortunately, the fix introduces not only big penalties in performance, but also it makes our code less readable and less debuggable.
Considering the discovered limitations, the vast adoption of Go within container software raises a few eyebrows.
Thank you for reading our blog. We build Weave Cloud, which is a hosted add-on to your clusters. It helps you iterate faster on microservices with continuous delivery, visualization & debugging, and Prometheus monitoring to improve observability.
Martynas is a recent graduate of ETH Zurich, who spends the majority of his time programming systems. When he is not hacking, most likely you can find him climbing the rock.
The electron npm package now includes a TypeScript definition file that provides detailed annotations of the entire Electron API. These annotation can improve your Electron development
experience even if you’re writing vanilla JavaScript. Justnpm install electron to get up-to-date Electron typings in your project.
TypeScript is an open-source programming language created by Microsoft. It’s
a superset of JavaScript that extends the language by adding support for
static types. The TypeScript community has grown quickly in recent years,
and TypeScript was ranked among the
most loved programming languages
in a recent Stack Overflow developer survey. TypeScript is described
as “JavaScript that scales”, and teams at
GitHub, Slack,
and Microsoft
are all using it to write scalable Electron apps that are used
by millions of people.
TypeScript supports many of the newer language features in JavaScript like
classes, object destructuring, and async/await, but its real differentiating
feature is type annotations.
Declaring the input and output datatypes expected by your program canreduce bugs by
helping you find errors at compile time, and the annotations can also serve
as a formal declaration of how your program works.
When libraries are written in vanilla Javascript, the types are often vaguely
defined as an afterthought when writing documentation. Functions can often
accept more types than what was documented, or a function can have invisible
constraints that are not documented, which can lead to runtime errors.
TypeScript solves this problem with definition files.
A TypeScript definition file describes all the functions of a library and its
expected input and output types. When library authors bundle a TypeScript
definition file with their published library, consumers of that library canexplore its API right inside their editor
and start using it right away, often without needing to consult the library’s
documentation.
Many popular projects likeAngular,Vue.js,node-github
(and now Electron!) compile their own definition file and bundle it with their
published npm package. For projects that don’t bundle their own definition file,
there is
DefinitelyTyped,
a third-party ecosystem of community-maintained definition files.
Installation
Starting at version 1.6.10, every release of Electron includes its own
TypeScript definition file. When you install the electron package from npm,
the electron.d.ts file is bundled automatically with the
installed package.
The safest way to install Electron is using an exact version number:
If you were already using third-party definitions like @types/electron
and @types/node, you should remove them from your Electron project to prevent
any collisions.
The definition file is derived from ourstructured API documentation,
so it will always be consistent with Electron’s API documentation.
Just install electron and you’ll always get TypeScript definitions that are
up to date with the version of Electron you’re using.
Usage
For a summary of how to install and use Electron’s new TypeScript annotations,
watch this short demo screencast:
Once your editor is configured for TypeScript, you’ll start to see more
context-aware behavior like autocomplete suggestions, inline method reference,
argument checking, and more.
If you’re new to TypeScript and want to learn more, this
introductory video from Microsoft
provides a nice overview of why the language was created, how it works,
how to use it, and where it’s headed.
There’s also a
handbook
and aplayground
on the official TypeScript website.
Because TypeScript is a superset of JavaScript, your existing JavaScript code is
already valid TypeScript. This means you can gradually transition an existing
JavaScript project to TypeScript, sprinkling in new language features as needed.
Wal-Mart Stores Inc. is testing a program that sends store employees to deliver online orders at the end of their shifts, a new push by the world’s biggest retailer to use its large physical footprint to match Amazon.com Inc.’s convenient options for web purchases.
Workers can opt in to earn extra money by making deliveries using their own cars. They’re assigned packages based on where they live so the route aligns with their commute home, the company said Thursday in a blog post. Wal-Mart didn’t specify how the employees will be compensated. The test began at three locations in Arkansas and New Jersey.
Wal-Mart is tapping into its 4,700 U.S. stores and more than a million retail employees as it seeks to redefine itself in an age of e-commerce dominated by Amazon, which offers delivery of some products in as little as an hour in some cities. Online spending will increase by 16 percent this year -- more than four times the pace of overall retail -- to reach $462 billion, according to EMarketer Inc.
About 90 percent of the U.S. population lives within 10 miles of a Wal-Mart, and the company is using those locations as shipping hubs to compete with Amazon on the last mile of delivery -- the most expensive part of getting goods to customers. By using existing workers in their own cars, Wal-Mart could create a vast network with little upfront cost, similar to how Uber Technologies Inc. created a ride-hailing service without owning any cars.
"Imagine all the routes our associates drive to and from work and the houses they pass along the way," said Marc Lore, who took over Wal-Mart’s e-commerce operation last year after the retailer purchased his startup, Jet.com, for $3.3 billion. "This test could be a game-changer."
Many online orders in tests have been delivered overnight using store employees, Lore said, showing how the initiative could also be used to narrow delivery times.
The lines between internet and brick-and-mortar commerce are blurring as retailers -- including Amazon -- try to accommodate a variety of shopping preferences. Bentonville, Arkansas-based Wal-Mart offers free two-day delivery on millions of items to compete with Amazon’s standard delivery time. It also lets customers buy groceries online and pick them up at stores and offers discounts to online shoppers who pick up items at stores rather than having them delivered.
Amazon, meanwhile, has stepped up its experimentation with physical locations. It’s slowly opening physical bookstores in big cities around the U.S., which double as showrooms for Amazon gadgets like its Kindle readers and Echo voice-activated speakers. The company opened two drive-in grocery pickup kiosks in its hometown of Seattle earlier this month, its first attempt to match the click-and-collect options rolled out by Wal-Mart and other big-box competitors.
For more on logistics, check out the Decrypted podcast:
Internet protocols are best thought of as a stack of layers.
Ethernet provides physical data transfer and link between two point-to-point devices.
IP provides a layer of addressing, allowing routers and large-scale networks to exist, but it's connectionless.
Packets are fired into the ether, with no indication of whether they arrived or not.
TCP adds a layer of reliable transmission by using sequence numbers, acknowledgement, and retransmission.
Finally, application-level protocols like HTTP are layered on top of TCP.
At this level, we already have addressing and the illusion of reliable transmission and persistent connections.
IP and TCP save application developers from constantly reimplement packet retransmission and addressing and so on.
The independence of these layers is important.
For example, when packets were lost during my 88.5 MB video transfer, the Internet's backbone routers didn't know; only my machine and the web server knew.
Dozens of duplicate ACKs from my computer were all dutifully routed over the same routing infrastructure that lost the original packet.
It's possible that the router responsible for dropping the lost packet was also the router carrying its replacement milliseconds later.
This is an important point for understanding the Internet: the routing infrastructure doesn't know about TCP; it only routes.
(There are exceptions to this, as always, but it's generally true.)
Layers of the protocol stack operate independently, but they weren't designed independently.
Higher-level protocols tend to be built on lower-level ones: HTTP is built on TCP is built on IP is built on Ethernet.
Design decisions in lower levels often influence decisions in higher levels, even decades later.
Ethernet is old and concerns the physical layer, so its needs set the base parameters.
An Ethernet payload is at most 1,500 bytes.
The IP packet needs to fit within an Ethernet frame.
IP has a minimum header size of 20 bytes, so the maximum payload of an IP packet is 1,500 - 20 = 1,480 bytes.
Likewise, the TCP packet needs to fit within the IP packet.
TCP also has a minimum header size of 20 bytes, leaving a maximum TCP payload of 1,480 - 20 = 1,460 bytes.
In practice, other headers and protocols can cause further reductions. 1,400 is a conservative TCP payload size.
The 1,400 byte limit influences modern protocols' designs.
For example, HTTP requests are generally small.
If we fit them into one packet instead of two, we reduce the probability of losing part of the request, with a correspondingly reduced likelihood of TCP retransmissions.
To squeeze every byte out of small requests, HTTP/2 specifies compression for headers, which are usually small.
Without context from TCP, IP, and Ethernet, this seems silly: why add compression to a protocol's headers to save only a few bytes?
Because, as the HTTP/2 spec says in the introduction to section 2, compression allows "many requests to be compressed into one packet".
HTTP/2 does header compression to meet the constraints of TCP, which come from constraints in IP, which come from constraints in Ethernet, which was developed in the 1970s, introduced commercially in 1980, and standardized in 1983.
One final question: why is the Ethernet payload size set at 1,500 bytes?
There's no deep reason; it's just a nice trade-off point.
There are 42 bytes of non-payload data needed for each frame.
If the payload maximum were only 100 bytes, only 70% (100/142) of time would be spent sending payload.
A payload of 1,500 bytes means about 97% (1500/1542) of time is spent sending payload, which is a nice level of efficiency.
Pushing the packet size higher would require larger buffers in the devices, which we can't justify simply to get another percent or two of efficiency.
In short: HTTP/2 has header compression because of the RAM limitations of networking devices in the late 1970s.
Distributed databases often require you to give up SQL and ACID transactions as a trade-off for scale. Citus is a different kind of distributed database. As an extension to PostgreSQL, Citus can leverage PostgreSQL’s internal logic to distribute more sophisticated data models. If you’re building a multi-tenant application, Citus can transparently scale out the underlying database in a way that allows you to keep using advanced SQL queries and transaction blocks.
In multi-tenant applications, most data and queries are specific to a particular tenant. If all tables have a tenant ID column and are distributed by this column, and all queries filter by tenant ID, then Citus supports the full SQL functionality of PostgreSQL—including complex joins and transaction blocks—by transparently delegating each query to the node that stores the tenant’s data. This means that with Citus, you don’t lose any of the functionality or transactional guarantees that you are used to in PostgreSQL, even though your database has been transparently scaled out across many servers. In addition, you can manage your distributed database through parallel DDL, tenant isolation, high performance data loading, and cross-tenant queries.
Transparent query routing in Citus
When processing a query on a distributed table, Citus first invokes the regular PostgreSQL query planner. The planner builds internal lists of conditions on all the tables involved in the query, taking joins into account. PostgreSQL uses this logic to determine whether it can use an index to read from a table. Citus leverages this logic to determine which shards, and by extension which nodes, are involved in a query.
If the Citus query planner can tell from filters on the distribution key(s) that only a single node needs to be involved in a query, then Citus only has to rewrite the table names to shard names and route the query to the right node. In Citus, shards are just regular PostgreSQL tables, so the query on the shards can be handled by the regular PostgreSQL query planning logic.
The approach of transparently routing queries based on filters allows Citus to handle arbitrarily complex SQL queries and multi-statement ACID transactions on distributed tables, as long as each one can be delegated to a single node. Moreover, executing a single node query involves minimal network overhead since it can be sent over a previously established connection.
A real-world example: a multi-tenant TODO app
Let’s take an example app and see how this might all apply.
Imagine we’re building a TODO app, in which users (tenants) can create their own TODO lists. In the database we have a table of TODO lists, and a table of TODO items, and use the user_id column as the distribution key:
CREATE TABLE todo_lists (
  user_id bigint NOT NULL,
  list_id bigserial NOT NULL,
  list_name text NOT NULL,
  PRIMARY KEY (user_id, list_id)
);

CREATE TABLE todo_items (
  user_id bigint NOT NULL,
  list_id bigint NOT NULL,
  item_id bigserial NOT NULL,
  position int NOT NULL DEFAULT 0,
  description text NOT NULL DEFAULT '',
  created_at timestamptz NOT NULL DEFAULT now(),
  done bool NOT NULL DEFAULT false,
  type_id int,
  PRIMARY KEY (user_id, list_id, item_id)
);

-- Distribute tables by user_id using Citus
SELECT create_distributed_table('todo_lists', 'user_id');
SELECT create_distributed_table('todo_items', 'user_id');

INSERT INTO todo_lists (user_id, list_name) VALUES (1, 'work things');
INSERT INTO todo_items (user_id, list_id, description) VALUES (1, 1, 'write TODO blog post');
INSERT INTO todo_items (user_id, list_id, description) VALUES (1, 1, '???');
INSERT INTO todo_items (user_id, list_id, description) VALUES (1, 1, 'profit');

INSERT INTO todo_lists (user_id, list_name) VALUES (1, 'personal things');
INSERT INTO todo_items (user_id, list_id, description) VALUES (1, 2, 'go to work');
Now say we want to display the user’s TODO lists and order by the number of open items.
A natural way of getting this information from the database would be to do a subquery on todo_items to get the number of items per list and then join with todo_lists and order by the number of items.
SELECT list_id, list_name, num_items
FROM
  todo_lists lists
  JOIN
  (SELECT list_id, count(*) AS num_items FROM todo_items WHERE NOT done GROUP BY list_id) counts
  USING (list_id)
WHERE  user_id = 1
ORDER BY num_items DESC;
Beware that there is something subtly wrong with the query above. The subquery on todo_items does not filter by user_id = 1, nor does it join by user_id, which means that the subquery may need to inspect the TODO items of all users. If users have the same list ID, then the query could actually return results from other users (!). In addition, the resulting query plan will be inefficient even when using regular PostgreSQL tables since it cannot use the index.
When running the query on a distributed table, the Citus query planner concludes that the query cannot be distributed efficiently and throws the error below, but fortunately this is very easy to fix.
ERROR: cannot pushdown the subquery since not all relations are joined using distribution keys
As a note: The type of distributed operations that require a large number of network round-trips are prohibitive for interactive applications. Citus typically errors out for such operations, rather than try to distribute them at a very high cost.
Enabling SQL query delegation via filters & joins on distribution keys
To make the TODO lists query work on Citus, we need to ensure that the query planner knows it only needs to query a single user in each subquery and the query can be delegated to a single node—meaning it can use all of PostgreSQL’s SQL features. The simplest way is to achieve this is to add a filter on the distribution key user_id to subqueries:
SELECT list_id, list_name, num_items
FROM
  todo_lists lists
  JOIN
  ( SELECT list_id, count(*) AS num_items FROM todo_items WHERE NOT done AND user_id = 1 GROUP BY list_id) counts
  USING (list_id)
WHERE  user_id = 1
ORDER BY num_items DESC;

 list_id |    list_name    | num_items
---------+-----------------+-----------
       1 | work things     |         3
       2 | personal things |         1
(2 rows)

Time: 2.024 ms
Another way to run the query on Citus is to always join on the distribution key, such that the filter can be derived from the join, which gives an equivalent query plan:
SELECT list_id, list_name, num_items
FROM
  todo_lists lists
  JOIN
  ( SELECT user_id, list_id, count(*) AS num_items FROM todo_items WHERE NOT done GROUP BY user_id, list_id) counts
  USING (user_id, list_id)
WHERE  user_id = 1
ORDER BY num_items DESC;

 list_id |    list_name    | num_items
---------+-----------------+-----------
       1 | work things     |         3
       2 | personal things |         1
(2 rows)

Time: 2.014 ms
By adding the right filters and/or joins, all SQL features can be used with Citus. Even without Citus, employing filters and joins is often a good idea since it makes your queries more efficient and more secure.
Running multi-statement transactions in Citus
By ensuring that queries always filter by tenant, Citus can also support transaction blocks with the same ACID guarantees as PostgreSQL. In our TODO example, we could use transaction blocks to reorder the list in a transactional way:
BEGIN;
UPDATE todo_items SET position = 2 WHERE user_id = 1 AND item_id = 1;
UPDATE todo_items SET position = 1 WHERE user_id = 1 AND item_id = 2;
COMMIT;
The main requirement for enabling transaction blocks is that all queries specify the same user_id value.
Avoid querying multiple nodes when querying a single node will do
Citus supports parallel analytical queries across all shards, which is powerful and has many applications. However, for simple lookups, it’s better to avoid the overhead of querying all shards by adding the right filters.
For example, an application might perform lookup queries such as:
SELECT item_id, description FROM todo_items WHERE list_id = 1 ORDER BY position;
 item_id |     description
---------+----------------------
       1 | write TODO blog post
       2 | ???
       3 | profit
(3 rows)

Time: 54.188 ms
Citus does not know which shard the list_id corresponds to, hence it will need to query all the shards. To do so, Citus opens multiple connections to every node and queries all the shards in parallel. In this case, querying all the shards in parallel is adding ~50ms of overhead—which is fine when you need to query a significant amount of data and you want the parallelism to get it done fast (the ~50ms of overhead is typically dwarfed by the overall size of the query). For small, frequent lookups, we recommend you always add a filter on the distribution key, such that Citus can route each query to a single node.
When migrating an existing application from PostgreSQL to Citus, you may have queries that don’t include a filter on the distribution key. Your queries that do not include a distribution key may silently work, but incur more overhead than they should. To find queries that don’t include distribution key filters, you can log multi-shard queries by setting citus.multi_task_query_log_level (new in Citus 6.2). For example:
SET citus.multi_task_query_log_level TO 'WARNING';
During testing, it is often a good idea to make multi-shard queries throw an error by setting the log level to ERROR:
SET citus.multi_task_query_log_level TO 'ERROR';
SELECT item_id, description FROM todo_items WHERE list_id = 1 ORDER BY position;
ERROR:  multi-task query about to be executed
After adding a user_id filter to the query, the query can be delegated to a single node and executes in under 2ms.
SELECT item_id, description FROM todo_items WHERE list_id = 1 AND user_id = 1 ORDER BY position;
 item_id |     description
---------+----------------------
       1 | write TODO blog post
       2 | ???
       3 | profit
(3 rows)

Time: 1.326 ms
Tip for when you do need to run single-tenant & multi-tenant queries
In some cases, you explicitly do want to run multi-shard queries, for example for cross-tenant analytics. It can be useful to use different configuration settings for different roles, for instance:
ALTER ROLE app_test SET citus.multi_task_query_log_level TO 'ERROR';
ALTER ROLE app_prod SET citus.multi_task_query_log_level TO 'WARNING';
ALTER ROLE analytics SET citus.multi_task_query_log_level TO off;
Roles allow you to differentiate the behaviour of the database for different applications. For a user-facing application, you can make sure that you don’t perform queries across multiple tenants by setting citus.multi_task_query_log_level for the database role. If you also have an internal analytics dashboard that does need to query all the data at once, then you can remove the restriction by using a different role.
In Citus Cloud, you can easily set up different roles in your Citus cluster through the dashboard.
Use reference tables for data shared across tenants
Some tables cannot be distributed by tenant because they contain data that are relevant across tenants. In that case, you can also create a reference table that is automatically replicated to all nodes. A reference table can be used in SQL queries without any extra filters.
For example, we can create a reference table for TODO types and get the number of TODO items by type for a given user:
CREATE TABLE todo_types (
  type_id bigserial NOT NULL,
  type_name text NOT NULL,
  PRIMARY KEY (type_id)
);
SELECT create_reference_table('todo_types');

SELECT type_name, count(*)
FROM
  todo_types
  LEFT JOIN
  todo_items
  USING (type_id)
WHERE user_id = 1
ORDER BY 2 DESC LIMIT 10;
Reference tables provide a convenient way to scale out more complex data models. They do have lower write performance because all writes need to be replicated to all nodes. If your table can be distributed by tenant ID then doing so is always preferred.
A multi-tenant database that does not require you to trade off SQL & ACID for scale
When using Citus, your application still talks to a Postgres server, and Citus handles queries by delegating work to a cluster of Postgres servers. Because Citus is an extension to Postgres (and not a fork), Citus supports the same functions, data types (e.g. JSONB), and extensions that are available in regular Postgres. It’s easy to migrate a multi-tenant application built on PostgreSQL to Citus, with only minor modifications to your schema and queries. Once you are using Citus, you can scale out horizontally to add as much memory, CPU and storage as your application requires.
Test driving Citus
If you want to test drive Citus, the quickest way to get started is to sign up for Citus Cloud, our fully-managed database as a service that is hosted on AWS.
In Citus Cloud, you can create Citus clusters with a configurable number of PostgreSQL 9.6 servers and high availability, backed of course by our team with their many years of experience managing millions of PostgreSQL databases.
If you have any questions about migrating your application to Citus, don’t hesitate to contact us, and be sure to check out our Citus documentation.
Gah! Vive only? Is there any hope for Oculus or OSVR support? I would LOVE to mess around with this, but I have an Oculus Rift.
If it's too much trouble, don't worry; I'd still like for you to focus most of your time on Miegakure. However, if it's a simple little add-a-few-calls and boom, that would be awesome.
Your data comes from all places. Shouldn't you be able to
handle everything with one app? Strukt natively supports:
folders and files
CSV, TSV, and Excel (XLSX) files
HTML tables/lists, JSON structures, and other data from the web
local data stores like Git and SQLite
your Mac contacts, calendars, and events
Data Types
Your shell can process any data source, but only as plain
text (or bytes). Strukt has a rich collection of actual data
types:
Visualization
Tables are a great model for data, but they're not so great
for visualization. That's why, in addition to tables, Strukt
also supports charts, maps, plain text, and HTML views.
Interactive and keyboard-friendly
Many ETL tools can connect any data source, and manipulate
data in arbitrary ways, but are difficult to use.
Strukt is fully keyboard-friendly (Mac/emacs/vi styles), and
includes alias for common Unix commands you might already
know. As you type, it displays partial results.
It will even automatically update the results when it sees
that your source data changed, if it's safe to do so.
Once in a while I encounter a question whether C++ is suitable for embedded development and bare metal development in particular. There are multiple articles of how C++ is superior to C, that everything you can do in C you can do in C++ with a lot of extras, and that it should be used even with bare metal development. However, I haven't found many practical guides or tutorials of how to use C++ superiority and boost development process compared to conventional approach of using “C” programming language. With this book I hope to explain and show examples of how to implement soft real time systems without prioritising interrupts and without any need for complex real time task scheduling. Hopefully it will help someone to get started with using C++ in embedded bare metal development.
Explore in Sheets, powered by machine learning,helps teams gain insights from data, instantly. Simply ask questions—in words, not formulas—to quickly analyze your data. For example, you can ask “what is the distribution of products sold?” or “what are average sales on Sundays?” and Explore will help you find the answers.
Now, we’re using the same powerful technology in Explore to make visualizing data even more effortless. If you don’t see the chart you need, just ask. Instead of manually building charts, ask Explore to do it by typing in “histogram of 2017 customer ratings” or “bar chart for ice cream sales.” Less time spent building charts means more time acting on new insights.
Peer-to-peer bitcoin exchanges face new legal challenges in America and the trend will probably spread to other money-hungry countries. There is a simple reason.
Regulators use financial institutions such as banks to control the flow of wealth. The digital exchange companies that serve as “trusted third parties” are the main control points for bitcoin. That’s the point at which privacy is stripped from users, and the transfer of wealth can be closely monitored. For regulations to work, therefore, users must be herded toward trusted third parties who function as an arm of the government.
Because peer-to-peer exchanges sidestep digital exchanges, the former are slowly being criminalized.
Sal Mansy should serve as a cautionary tale.
Criminalizing Localbitcoins Exchanges
On May 17, entrepreneur Sal Mansy of Detroit, Michigan plead guilty to violating Title 18, Section 1960 of the United States Code. The statute specifically refers to Section 5330 of Title 31 in the U.S. Code of Laws, which states, in part, “Any person who owns or controls a money transmitting business shall register the business…with the Secretary of the Treasury.”
Registration involves providing the feds with an impressive list of information which culminates with the vague catch-all statement, “[s]uch other information as the Secretary of the Treasury may require.” In short, both statutes forbid a business to act as a money service without obtaining government licenses and turning over any information demanded.
The unlicensed Mansy had been trading bitcoin for years. At first, the purchase of bitcoin was apparently conducted through digital currency exchanges such as Coinbase and Bitstamp, with the sale occurring on Localbitcoins. The resulting profit was then channeled through the business bank accounts of his corporation. Coinbase closed Mansy’s account in 2014 partly because he had not registered with the US Financial Crimes Enforcement Network (FinCEN) as a money transmitter.
Unfortunately, Mansy sold bitcoin to undercover agents who may have been alerted to his activity by the digital exchanges, his bank or both. His residence was raided and three bank accounts were seized which collectively amounted to about $180,000. Mansy could receive a sentence of five years as well as a $250,000 fine. A tax investigation has not been mentioned but one seems likely to occur.
Localbitcoins is coming under attack because it is an immensely popular alternative to digital exchanges for users who wish to retain both privacy and control of their wealth. The company describes itself as a peer-to-peer exchange “where users can buy and sell Bitcoins to and from each other.” Traders advertise at the online site “with the price and the payment method they want to offer.” As in Craigslist, buyers and sellers in the same area can find each through published ads.
Mansy Is Not Alone
On May 2, prominent businessman Jason Klein pled guilty before a Missouri court to charges of “conducting an unlicensed and unregistered money transmitting business.” He had also sold coins through a Localbitcoins to “two undercover agents.” Klein ran afoul of “both the Financial Crimes Enforcement Network (FinCEN) as well as the Missouri government to operate a money transmission business.”
Both Mansy and Klein may have been selectively prosecuted due to their prominence in order to send a warning to others. The Springfield Business Journal (May 15) reported that “many [in the community] were left in disbelief and confusion after…Jason Klein pleaded guilty to a federal charge for selling bitcoin.” Klein is “president of the Association of Information Technology Professionals’ Ozarks chapter, and was elected to serve this year on the leadership council of The Network, the chamber’s group for young professionals.” He also faces up to five years in prison and/or a $250,000 fine.
If the two cases are meant as a warning to other traders, both men are likely to be both sentenced and fined.
The news feature at the Coindesk site (May 3) commented on a flurry of similar prosecutions. They include:
On April 27, Richard Petix of New York State pled guilty “to making material false statements and operating an unlicensed money transmitting business.”
On April 20, Thomas Costanzo of Arizona:
was detained by the U.S. Department of Homeland Security when officers raided his home….[A]gents were authorized to confiscate financial records and any illegal contraband in his home.
The arrest of both Petix and Constanzo had complicating factors. Petix is a sex offender who illegally accessed a computer. Constanzo possessed ammunition in violation of an agreement from a prior conviction. The money laundering charges were added later as a result of continuing investigation.
By contrast, Mansy’s and Klein’s conviction was about bitcoin, pure and simple.
A Change In How The Law Treats Peer-to-Peer?
The preceding arrests in four different states may signal a shift in how the law views and handles certain forms of peer-to-peer trading. In July 2016, for example, Bloomberg reported on “the first state money-laundering prosecution involving the virtual currency.” The article opened, “A Florida judge threw out state money-laundering charges against a man who was accused of illegally selling more than $1,500 in bitcoins to undercover detectives, concluding the virtual currency doesn’t qualify as money.” The state is appealing the decision.
Cases may no longer be thrown out. A May 6 headline in the Miami Herald stated, “Florida criminals who use bitcoins could now face money-laundering charges.” Those arrested do not need to deal drugs, sell sex or commit fraud, of course. Merely being unlicensed is a crime.
As Jamie Redman pointed out at bitcoin.com, the bill “will essentially add bitcoin to the current definitions of ‘monetary instruments’ under Florida’s money laundering act.” The bill has passed both the Florida House and Senate; it awaits the governor’s signature.
The Crucial Importance of Freedom through Peer-to-Peer
Peer-to-peer buyers do not seem to be targeted yet. Nor is it necessary to do so for Localbitcoins to halt in America. If no peer-to-peer sellers are willing to risk draconian punishment, then digital exchanges come closer to a monopoly on sales. Either that or the sellers will apply for licenses and the government will come closer to knowing everything financial about everyone.
For bitcoin to bring real freedom, it must eschew the trusted third party approach because those parties almost always interact with government agencies in much the same manner as central banks do. They strip away privacy from customers and report on their financial practices.
Peer-to-peer liberates users. Personal wealth is protected from the corrupt money-grab of central banking. The relative anonymity it brings allows freedom of speech, especially on controversial and political matters; this is why election ballots are cast in secret. Peer-to-peer also supports peaceful individuals, who are called criminals by a government, to survive the onslaught.
When Wikileaks faced a financial blockage in 2010, for example, bitcoin became the only way most people could make a donation. Many if not most of the donations were anonymous. And peer-to-peer exchanges will become even more important in the future because the other most effective and private peer-to-peer transfer is being threatened: cash.
Governments will continue to assault bitcoin and the rights of users. Digital exchanges will continue to evolve into a grotesque imitation of crony banks. Both will fail. But before they do…how many traders will face five years in prison for the ‘crime’ of selling a “good”—in both senses of the word—to a person who wants to buy it?
What is needed is an electronic payment system based on cryptographic proof instead of trust,allowing any two willing parties to transact directly with each other without the need for a trusted third party
—Satoshi Nakamoto
Do you think the bitcoin ecosystem will eventually get away from trusted third party exchanges? Let us know in the comments section below.
Images courtesy of Shutterstock, RBC Group, Euronext, Coin.dance
Need to calculate your bitcoin holdings? Check our tools section.
Smarking is an MIT spin-off based in San Francisco that brings big data to the parking industry. Parking represents enormous and growing market opportunities ($100 billion worldwide) with fascinating technical challenges. Starting as a SaaS company providing data analytics and predictions to parking professionals, Smarking holds ambitious goals for the future. Since launching, Smarking has graduated from Y Combinator, attracted top notch investors, and is growing rapidly.
We at Smarking love people who constantly hack, lead, and grow. You will have opportunities to take on major projects and make a big impact on both the Smarking team and the entire parking industry.
ABOUT THIS POSITION
Instead of filling specific needs, we hire talented engineers first and then work with them to map out areas of potentials and growth. Your typical projects would involve one or more of the following areas, although we do NOT expect you to have intimate knowledge in all of them:
SOUND LIKE A FIT?
Regardless of your level of experience, we look for people with high growth potential in both technical and leadership skills. If Smarking sounds like a great fit, please apply. We look forward to hearing from you!
Technology has become an asset in finance: financial institutions are now evolving to technology companies rather than just staying occupied with just the financial aspect: besides the fact that technology brings about innovation the speeds and can help to gain a competitive advantage, the speed and frequency of financial transactions, together with the large data volumes, makes that financial institutions’ attention for technology has increased over the years and that technology has indeed become a main enabler in finance.
Among the hottest programming languages for finance, you’ll find R and Python, alongside languages such as C++, C# and Java. In this tutorial, you’ll learn how to get started with Python for finance. The tutorial will cover the following:
The basics that you need to get started: for those who are new to finance, you’ll first learn more about the stocks and trading strategies, what time series data is and what you need to set up your workspace.
An introduction to time series data and some of the most common financial analyses, such as moving windows, volatility calculation, … with the Python package Pandas.
The development of a simple momentum strategy: you’ll first go through the development process step-by-step and start off by formulating and coding up a simple algorithmic trading strategy.
Next, you’ll backtest the formulated trading strategy with Pandas, zipline and Quantopian.
Afterwards, you’ll see how you can do optimizations to your strategy to make it perform better and you’ll eventually evaluate your strategy’s performance and robustness.
Download the Jupyter notebook of this tutorial here.
Getting Started With Python for Finance
Before you go into trading strategies, it’s a good idea to get the hang of the basics first. This first part of the tutorial will focus on explaining the Python basics that you need to get started. This does not mean, however, that you’ll start completely from zero: you should have at least done DataCamp’s free Intro to Python for Data Science course, in which you learned how to work with Python lists, packages and NumPy. Additionally, it is desired to already know the basics of Pandas, the well-known Python data manipulation package, but this is no requirement. If you do want to already get into Pandas before starting this tutorial, consider taking DataCamp’s Pandas Foundations course.
When a company wants to grow and undertake new projects or expand, it can issue stocks to raise capital. A stock represents a share in the ownership of a company and is issued in return for money. Stocks are bought and sold: buyers and sellers trade existing, previously issued shares. The price at which stocks are sold can move independent of the company’s success: the prices instead reflect supply and demand. This means that, whenever a stock is considered as ‘desirable’, due to a success, popularity, … the stock price will go up.
Note that stocks are not exactly the same as bonds, which is when companies raise money through borrowing, either as a loan from a bank or by issuing debt.
As you just read, buying and selling or trading is essential when you’re talking about stocks, but certainly not limited to it: trading is the act of buying or selling an asset, which could be financial security, like stock, a bond or a tangible product, such as gold or oil.
Stock trading is then the process of the cash that is paid for the stocks is converted into a share in the ownership of a company, which can be converted back to cash by selling, and this all hopefully with a profit. Now, to achieve a profitable return, you either go long or short in markets: you either by shares thinking that the stock price will go up to sell at a higher price in the future, or you sell your stock, expecting that you can buy it back at a lower price and realize a profit. When you follow a fixed plan to go long or short in markets, you have a trading strategy.
Developing a trading strategy is something that goes through a couple of phases, just like when you, for example, build machine learning models: you formulate a strategy and specify it in a form that you can test on your computer, you do some preliminary testing or backtesting, you optimize your strategy and lastly, you evaluate the performance and robustness of your strategy.
Trading strategies are usually verified by backtesting: you reconstruct, with historical data, trades that would have occurred in the past using the rules that are defined with the strategy that you have developed. This way, you can get an idea of the effectiveness of your strategy and you can use it as a starting point to optimize and improve your strategy before applying it to real markets. Of course, this all relies heavily on the underlying theory or belief that any strategy that has worked out well in the past will likely also work out well in the future, and, that any strategy that has performed poorly in the past will likely also do badly in the future.
A time series is a sequence of numerical data points taken at successive equally spaced points in time. In investing, a time series tracks the movement of the chosen data points, such as the stock price, over a specified period of time with data points recorded at regular intervals. If you’re still in doubt about what this would exactly look like, take a look at the following example:
You see that the dates are placed on the x-axis, while the price is featured on the y-axis. The “successive equally spaced points in time” in this case means that the days that are featured on the x-axis are 14 days apart: note the difference between 3/7/2005 and the next point, 3/31/2005, and 4/5/2005 and 4/19/2005.
However, what you’ll often see when you’re working with stock data is not just two columns, that contain period and price observations, but most of the times, you’ll have five columns that contain observations of the period and the opening, high, low and closing prices of that period. This means that, if your period is set at a daily level, the observations for that day will give you an idea of the opening and closing price for that day and the extreme high and low price movement for a particular stock during that day.
For now, you have a basic idea of the basic concepts that you need to know to go through this tutorial. These concepts will come back soon enough and you’ll learn more about them later on in this tutorial.
Getting your workspace ready to go is an easy job: you basically just make sure you have Python and an Integrated Development Environment (IDE) running on your system. However, there are some ways in which you can get started that are maybe a little easier when you’re just starting out.
Take for instance Anaconda, a high performance distribution of Python and R and includes over 100 of the most popular Python, R and Scala packages for data science. Additionally, installing Anaconda will give you access to over 720 packages that can easily be installed with conda, our renowned package, dependency and environment manager, that is included in Anaconda. And, besides all that, you’ll get the Jupyter Notebook and Spyder IDE with it.
The latter offers you a couple additional advantages over using, for example, Jupyter or the Spyder IDE, since it provides you everything you need specifically to do financial analytics in your browser! With the Quant Platform, you’ll gain access to GUI-based Financial Engineering, interactive and Python-based financial analytics and your own Python-based analytics library. What’s more, you’ll also have access to a forum where you can discuss solutions or questions with peers!
When you’re using Python for finance, you’ll often find yourself using the data manipulation package, Pandas. But also other packages such as NumPy, SciPy, Matplotlib,… will pass by once you start digging deeper.
For now, let’s just focus on Pandas and using it to analyze time series data. This section will explain how you can import data, explore and manipulate it with Pandas. On top of all of that, you’ll learn how you can perform common financial analyses on the data that you imported.
The pandas-datareader package allows for reading in data from sources such as Google, Yahoo! Finance, World Bank,… If you want to have an updated list of the data sources that are made available with this function, go to the documentation. For this tutorial, you will use the package to read in data from Yahoo! Finance.
Note that the Yahoo API endpoint has recently changed and that, if you want to already start working with the library on your own, you’ll need to install a temporary fix until the patch has been merged into the master brach to start pulling in data from Yahoo! Finance with pandas-datareader. Make sure to read up on the issue here before you start on your own!
No worries, though, for this tutorial, the data has been loaded in for you so that you don’t face any issues while learning about finance in Python with Pandas.
It’s wise to consider though that, even though pandas-datareader offers a lot of options to pull in data into Python, it isn’t the only package that you can use to pull in financial data: you can also make use of libraries such as Quandl, for example, to get data from Google Finance:
For more information on how you can use Quandl to get financial data directly into Python, go to this page.
Lastly, if you’ve already been working in finance for a while, you’ll probably know that you most often use Excel also to manipulate your data. In such cases, you should know that you can integrate Python with Excel.
The first thing that you want to do when you finally have the data in your workspace is getting your hands dirty. However, now that you’re working with time series data, this might not seem as straightforward, since your index now contains DateTime values.
No worries, though! Let’s start step-by-step and explore the data first with some functions that you’ll might already know if you have some prior programming experience with R or if you’ve already worked with Pandas.
Either way, you’ll see it’s very easy!
As you saw in the code chunk above, you have used pandas_datareader to import data into your workspace. The resulting object aapl is a DataFrame, which is a 2-dimensional labeled data structure with columns of potentially different types. Now, one of the first things that you probably do when you have a regular DataFrame on your hands, is running the head() and tail() functions to take a peek at the first and the last rows of your DataFrame. Luckily, this doesn’t change when you’re working with time series data!
Tip: also make sure to use the describe() function to get some useful summary statistics about your data.
As you have seen in the introduction, this data clearly contains the four columns with the opening and closing price per day and the extreme high and low price movements for the Apple stock for each day. Additionally, you also get two extra columns: Volume and Adj Close.
The former column is used to register the number of shares that got traded during a single day. The latter, on the other hand, is the adjusted closing price: it’s the closing price of the day that has been slightly adjusted to include any actions that occurred at any time before the next day’s open. You can use this column to examine historical returns or when you’re performing a detailed analysis on historical returns.
Note how the index or row labels contain dates, and how your columns or column labels contain numerical values.
Tip: if you now would like to save this data to a csv file with the to_csv() function from pandas and that you can use the read_csv() function to read the data back into Python. This is extremely handy in cases where, for example, the Yahoo API endpoint has changed and you don’t have access to your data any longer :)
Now that you have briefly inspected the first lines of your data and have taken a look at some summary statistics, it’s time to go a little bit deeper.
One way to do this is by inspecting the index and the columns and by selecting, for example, the last ten rows of a certain column. The latter is called subsetting because you take a small subset of your data. The result of the subsetting is a Series, which is a one-dimensional labeled array that is capable of holding any type.
Remember that the DataFrame structure was a two-dimensional labeled array with columns that potentially hold different types of data.
Check all of this out in the exercise below. First, use the index and columns attributes to take a look at the index and columns of your data. Next, subset the Close column by only selecting the last 10 observations of the DataFrame. Make use of the square brackets [] to isolate the last ten values. You might already know this way of subsetting from other programming languages, such as R. To conclude, assign the latter to a variable ts and then check what type ts is by using the type() function. You can find the exercise here.
The square brackets can be nice to subset your data, but they are maybe not the most idiomatic way to do things with Pandas. That’s why you should also take a look at the loc() and iloc() functions: you use the former for label-based indexing and the latter for positional indexing.
In practice, this means that you can pass the label of the row labels, such as 2007 and 2006-11-01, to the loc() function, while you pass integers such as 22 and 43 to the iloc() function.
Tip: if you look closely at the results of the subsetting, you’ll notice that there are certain days missing in the data; If you look more closely at the pattern, you’ll see that it’s usually two or three days that are missing; These days are usually weekend days or public holidays and aren’t part of your data. This is nothing to worry about: it’s completely normal and you don’t have to fill in these missing days.
Besides indexing, you might also want to explore some other techniques to get to know your data a little bit better. You never know what else will show up. Let’s try to sample some 20 rows from the data set and then let’s resample the data so that aapl is now at the monthly level instead of daily. You can make use of the sample() and resample() functions to do this.
Very straightforward, isn’t it?
The resample() function is often used because it provides elaborate control and more flexibility on the frequency conversion of your times series: besides specifying new time intervals yourself and specifying how you want to handle missing data, you also have the option to indicate how you want to resample your data, as you can see in the code example above. This stands in clear contract to the asfreq() method, where you only have the first two options.
Tip: try this out for yourself in the IPython console of the above DataCamp Light chunk. Pass in aapl.asfreq("M", method="bfill") to see what happens!
Lastly, before you take your data exploration to the next level and start with visualizing your data and performing some common financial analyses on your data, you might already start to calculate the differences between the opening and closing prices per day. You can easily perform this arithmetic operation with the help of Pandas; Just substract the values in the Open column of your aapl data from the values of the Close column of that same data. Or, in other words, subtract aapl.Close from aapl.Open. You storethe result in a new column of the aapl DataFrame called diff and then you delete it again with the help of del.
Tip: make sure to comment out the last line of code so that the new column of your aapl DataFrame doesn’t get removed and you can check the results of your arithmetic operation!
Of course, knowing the gains in absolute terms might already help you to get an idea of whether you’re making a good investment, but as a quant, you might be more interested in a more relative means of measuring your stock’s value, like how much the value of a certain stock has gone up or gone down. A way to do this is by calculating the daily percentage change.
This is good to know for now, but don’t worry about it just yet; You’ll go deeper into this in a bit!
This section introduced you to some ways to first explore your data before you start performing some prior analyses. However, you can still go a lot further in this; Consider taking our Python Exploratory Data Analysis if you want to know more.
Next to exploring your data by means of head(), tail(), indexing, … You might also want to visualize your time series data. Thanks to Pandas’ plotting integration with Matplotlib, this task becomes easy; Just use the plot() function and pass the relevant arguments to it. Additionally, you can also add the grid argument to indicate that the plot should also have a grid in the background.
If you run the code in the original article, you’ll come to the following plot:
Now that you have an idea of your data, what time series data is about and how you can use pandas to quickly explore your data, it’s time to dive deeper into some of the common financial analyses that you can do so that you can actually start working towards developing a trading strategy.
In the rest of this section, you’ll learn more about the returns, moving windows, volatility calculation and Ordinary Least-Squares Regression (OLS).
You can read more and practice these common financial analyses in the original article.
Creating A Trading Strategy
Now that you have done some primary analyses to your data, it’s time to formulate your first trading strategy; But before you go into all of this, why not first get to know some of the most common trading strategies? After a short introduction, you’ll undoubtedly move on more easily your trading strategy.
From the introduction, you’ll still remember that a trading strategy is a fixed plan to go long or short in markets, but much more information you didn’t really get yet; In general, there are two common trading strategies: the momentum strategy and the reversion strategy.
Firstly, the momentum strategy is also called divergence or trend trading. When you follow this strategy, you do so because you believe the movement of a quantity will continue in its current direction. Stated differently, you believe that stocks have momentum, or upward or downward trends, that you can detect and exploit.
Some examples of this strategy are the moving average crossover, the dual moving average crossover and turtle trading:
The moving average crossover is when the price of an asset moves from one side of a moving average to the other. This crossover represents a change in momentum and can be used as a point of making the decision to enter or exit the market. You’ll see an example of this strategy, which is the “hello world” of quantitative trading later on in this tutorial.
The dual moving average crossover occurs when a short-term average crosses a long-term average. This signal is used to identify that momentum is shifting in the direction of the short-term average. A buy signal is generated when the short-term average crosses the long-term average and rises above it, while a sell signal is triggered by a short-term average crossing long-term average and falling below it.
Turtle trading is a well-known trend following strategy that was originally taught by Richard Dennis. The basic strategy is to buy futures on a 20-day high and sell on a 20-day low.
Secondly, the reversion strategy, which is also known as convergence or cycle trading. This strategy departs from the belief that the movement of a quantity will eventually reverse. This might seem a little bit abstract, but will not be so any more when you take the example. Take a look at the mean reversion strategy, where you actually believe that stocks return to their mean and that you can exploit when it deviates from that mean.
That already sounds a whole lot more practical, right?
Another example of this strategy, besides the mean reversion strategy, is the pairs trading mean-reversion, which is similar to the mean reversion strategy. Whereas the mean reversion strategy basically stated that stocks return to their mean, the pairs trading strategy extends this and states that if two stocks can be identified that have a relatively high correlation, the change in the difference in price between the two stocks can be used to signal trading events if one of the two moves out of correlation with the other. That means that if the correlation between two stocks has decreased, the stock with the higher price can be considered to be in a short position. It should be sold because the higher-priced stock will return to the mean. The lower-priced stock, on the other hand, will be in a long position becaue the price will rise as the correlation will return to normal.
Besides these two most frequent strategies, there are also other ones that you might come across once in a while, such as the forecasting strategy, which attempts to predict the direction or value of stock, in this case, in subsequent future time periods based on certain historical factors. There’s also the High Frequency Trading (HFT) strategy, which exploits the sub-millisecond market microstructure.
That’s all music for the future for now; Let’s focus on developing your first trading strategy for now!
As you read above, you’ll start with the “hello world” of quantitative trading: the moving average crossover. The strategy that you’ll be developing is simple: you create two separate Simple Moving Averages (SMA) of a time series with differing lookback periods, let’s say, 40 days and 100 days. If the short moving average exceeds the long moving average then you go long, if the long moving average exceeds the short moving average then you exit.
Remember that when you go long, you think that the stock price will go up and will sell at a higher price in the future (= buy signal); When you go short, you sell your stock, expecting that you can buy it back at a lower price and realize a profit (= sell signal).
This simple strategy might seem quite complex when you’re just starting out, but let’s take this step by step:
First define your two different lookback periods: a short window and a long window. You set up two variables and assign one integer per variable. Make sure that the integer that you assign to the short window is shorter than the integer that you assign to the long window variable!
Next, make an empty signals DataFrame, but do make sure to copy the index of your aapl data so that you can start calculating the daily buy or sell signal for your aapl data.
Create a column in your empty signals DataFrame that is named signal and initialize it by setting the value for all rows in this column to 0.0.
After the preparatory work, it’s time to create the set of short and long simple moving averages over the respective long and short time windows. Make use of the rolling() function to start your rolling window calculcations: within the function, specify the window and the min_period, and set the center argument. In practice, this will result in a rolling() function to which you have passed either short_window or long_window, 1 as the minimum number of observations in the window that are required to have a value, and False, so that the labels are not set at the center of the window. Next, don’t forget to also chain the mean() function so that you calculate the rolling mean.
After you have calculated the mean average of the short and long windows, you should create a signal when the short moving average crosses the long moving average, but only for the period greater than the shortest moving average window. In Python, this will result in a condition: signals['short_mavg'][short_window:] > signals['long_mavg'][short_window:]. Note that you add the [short_window:] to comply with the condition “only for the period greater than the shortest moving average window”. When the condition is true, the initialized value 0.0 in the signal column will be overwitten with 1.0. A “signal” is created! If the condition is false, the original value of 0.0 will be kept and no signal is generated. You use the NumPy where() function to set up this condition. Much the same like you read just now, the variable to which you assign this result is signals['signal'][short_window], because you only want to create signals for the period greater than the shortest moving average window!
Lastly, you take the difference of the signals in order to generate actual trading orders. In other words, in this column of your signals DataFrame, you’ll be able to distinguish between long and short positions, whether you’re buying or selling stock.
This wasn’t too hard, was it? Print out the signals DataFrame and inspect the results. Important to grasp here is what the positions and the signal columns mean in this DataFrame. You’ll see that it will become very important when you move on!
When you have taken the time to understand the results of your trading strategy, quickly plot all of this (the short and long moving averages, together with the buy and sell signals) with Matplotlib:
Now that you’ve got your trading strategy at hand, it’s a good idea to also backtest it and calculate its performance. But right before you go deeper into this, you might want to know just a little bit more about the pitfalls of backtesting, what components are needed in a backtester and what Python tools you can use to backtest your simple algorithm.
If, however, you’re already well up to date, you can simply move on to the implementation of your backtester!
Backtesting is, besides just “testing a trading strategy”, testing the strategy on relevant historical data to make sure that it’s an actual viable strategy before you start making moves. With backtesting, a trader can simulate and analyze the risk and profitability of trading with a specific strategy over a period of time. However, when you’re backtesting, it’s a good idea to keep in mind that there are some pitfalls, which might not be obvious to you when you’re just starting out.
For example, there are external events, such as market regime shifts, which are regulatory changes or macroeconomic events, which definitely influence your backtesting. Also liquidity constraints, such as the ban of short sales, could affect your backtesting heavily.
Next, there are pitfalls which you might introduce yourself when you, for example, overfit a model (optimization bias), when you ignore strategy rules because you think it’s better like that (interference), or when you accidentally introduce information into past data (lookahead bias).
These are just a few pitfalls that you need to take into account mainly after this tutorial, when you go and make your own strategies and backtest them.
Besides the pitfalls, it’s good to know that your backtester usually consists of some four essential components, which should usually present in every backtester. As such, a backtester consists of the following:
A data handler, which is an interface to a set of data,
A strategy, which generates a signal to go long or go short based on the data,
A portfolio, which generates orders and manages Profit & Loss (also known as “PnL”), and
An execution handler, which sends the order to the broker and receives the “fills” or signals that the stock has been bought or sold.
Besides these four components, there are many more that you can add to your backtester, depending on the complexity. You can definitely go a lot further than just these four components. However, for this beginner tutorial, you’ll just focus on getting these basic components to work in your code.
As you read above, a simple backtester consists of a strategy, a data handler, a portfolio and an execution handler. You have already implemented a strategy above, and you also have access to a data handler, which is the pandas-datareader or the Pandas library that you use to get your saved data from Excel into Python. The components that are still left to implement are the execution handler and the portfolio.
However, since you’re just starting out, you’ll not focus on implementing an execution handler just yet. Instead, you’ll see below how you can get started on creating a portfolio which can generate orders and manages the profit and loss:
First off, you’ll create set a variable initial_capital to set your initial capital and a new DataFrame positions. Once again, you copy the index from another DataFrame; In this case, this is the signals DataFrame because you want to consider the time frame for which you have generated the signals.
Next, you create a new column AAPL in the DataFrame. On the days that the signal is 1 and the the short moving average crosses the long moving average (for the period greater than the shortest moving average window), you’ll buy a 100 shares. The days on which the signal is 0, the final result will be 0 as a result of the operation 100*signals['signal'].
A new DataFrame portfolio is created to store the market value of an open position.
Next, you create a DataFrame that stores the differences in positions (or number of stock)
Then the real backtesting begins: you create a new column to the portfolio DataFrame with name holdings, which stores the value of the positions or shares you have bought, multiplied by the ‘Adj Close’ price.
Your portfolio also contains a cash column, which is the capital that you still have left to spend: it is calculated by taking your initial_capital and subtracting your holdings (the price that you paid for buying stock).
You’ll also add a total column to your portfolio DataFrame, which contains the sum of your cash and the holdings that you own, and
Lastly, you also add a returns column to your portfolio, in which you’ll store the returns
As a last exercise for your backtest, visualize the portfolio value or portfolio['total'] over the years with the help of Matplotlib and the results of your backtest:
Note that, for this tutorial, the Pandas code for the backtester as well as the trading strategy has been composed in such a way that you can easily walk through it in an interactive way. In a real-life application, you might opt for a more object-oriented design with classes, which contain all the logic. You can find an example of the same moving average crossover strategy, with object-oriented design, here or check out this presentation.
You have seen now how you can implement a backtester with the Python’s popular data manipulation package Pandas. However, you can also see that it’s easy to make mistakes and that this might not be the most fail-safe option to use every time: you need to build most of the components from scratch, even though you already leverage Pandas to get your results.
That’s why it’s common to use a backtesting platform, such as Quantopian, for your backtesters. Quantopian is a free, community-centered, hosted platform for building and executing trading strategies. It’s powered by zipline, a Python library for algorithmic trading. You can use the library locally, but for the purpose of this beginner tutorial, you’ll use Quantopian to write and backtest your algorithm. Before you can do this, though, make sure that you first sign up and log in.
Next, you can get started pretty easily. Click “New Algorithm” to start writing up your trading algorithm or select one of the examples that has already been coded up for you to get a better feeling of what you’re exactly dealing with :)
Let’s start simple and make a new algorithm, but still following our simple example of the moving average crossover, which is the standard example that you find in the zipline Quickstart guide. It so happens that this example is very similar to the simple trading strategy that you implemented in the previous section. You see, though, that the structure in the code chunk below and in the screenshot above is somewhat different than what you have seen up until now in this tutorial, namely, you have two definitions that you start working from, namely initialize() and handle_data().
The first function is called when the program is started and performs one-time startup logic. As an argument, the initialize() function takes a context, which is used to store the state during a backtest or live trading and can be referenced in different parts of the algorithm, as you can see in the code below; You see that context comes back, among others, in the definition of the first moving average window. You see that you assign the result of the lookup of a security (stock in this case) by its symbol, (AAPL in this case) to context.security.
The handle_data() function is called once per minute during simulation or live-trading to decide what orders, if any, should be placed each minute. The function requires context and data as input: the context is the same as the one that you read about just now, while the data is an object that stores several API functions, such as current() to retrieve the most recent value of a given field(s) for a given asset(s) or history() to get trailing windows of historical pricing or volume data. These API functions don’t come back in the code below and are not in the scope of this tutorial.
Note That the code that you type into the Quantopian console will only work on the platform itself and not in your local Jupyter Notebook, for example!
You’ll see that the data object allows you to retrieve the price, which is the forward-filled, returning last known price, if there is one. If there is none, an NaN value will be returned.
Another object that you see in the code chunk above is the portfolio, which stores important information about…. Your portfolio. As you can see in the piece of code context.portfolio.positions, this object is stored in the context and is then also accessible in the core functions that context has to offer to you as a user. Note that the positions that you just read about, store Position objects and include information such as the number of shares and price paid as values. Additionally, you also see that the portfolio also has a cash property to retrieve the current amount of cash in your portfolio and that the positions object also has an amount property to explore the whole number of shares in a certain position.
The order_target() places an order to adjust a position to a target number of shares. If there is no existing position in the asset, an order is placed for the full target number. If there is a position in the asset, an order is placed for the difference between the target number of shares or contracts and the number currently held. Placing a negative target order will result in a short position equal to the negative number specified.
Tip: if you have any more questions about the functions or objects, make sure to check the Quantopian Help page, which contains more information about all (and much more) that you have briefly seen in this tutorial.
When you have created your strategy with the initialize() and handle_data() functions (or copy-pasted the above code) into the console on the left-hand side of your interface, just press the “Build Algorithm” button to build the code and run a backtest. If you press the “Run Full Backtest” button, a full backtest is run, which is basically the same as the one that you run when you build the algorithm, but you’ll be able to see a lot more in detail. The backtesting, whether ‘simple’ or full, can take a while; Make sure to keep an eye out on the progress bar on top of the page!
You can find more information on how to get started with Quantopian here.
Note that Quantopian is an easy way to get started with zipline, but that you can always move on to using the library locally in, for example, your Jupyter notebook.
Improving The Trading Strategy
You have successfully made a simple trading algorithm and performed backtests via Pandas, Zipline and Quantopian. It’s fair to say that you’ve been introduced to trading with Python. However, when you have coded up the trading strategy and backtested it, your work doesn’t stop yet; You might want to improve your strategy. There are one or more algorithms may be used to improve the model on a continuous basis, such as KMeans, k-Nearest Neighbors (KNN), Classification or Regression Trees and the Genetic Algorithm. This will be the topic of a future DataCamp tutorial.
Apart from the other algorithms you can use, you saw that you can improve your strategy by working with multi-symbol portfolios. Just incorporating one company or symbol into your strategy often doesn’t really say much. You’ll also see this coming back in the evaluation of your moving average crossover strategy. Other things that you can add or do differently is using a risk management framework or use event-driven backtesting to help mitigate the lookahead bias that you read about earlier. There are still many other ways in which you could improve your strategy, but for now, this is a good basis to start from!
Evaluating Moving Average Crossover Strategy
Improving your strategy doesn’t mean that you’re finished just yet! You can easily use Pandas to calculate some metrics to further judge your simple trading strategy. In this section, you’ll learn about the Sharpe ratio, the maximum drawdown and the Compound Annual Growth Rate (CAGR).
Besides these two metrics, there are also many other that you could consider, such as the distribution of returns, trade-level metrics, …
Go Further!
Well done, you’ve made it through this Python Finance introduction tutorial! You’ve covered a lot of ground, but there’s still so much more for you to discover!
Check out Yves Hilpisch’s Python For Finance book, which is a great book for those who already have gathered some background into Finance, but not so much in Python. “Mastering Pandas for Data Science” by Michael Heydt is also recommended for those who want to get started with Finance in Python! Also make sure to check out Quantstart’s articles for guided tutorials on algorithmic trading and this complete series on Python programming for finance.
If you’re more interested in continuing your journey into finance with R, consider taking Datacamp’s Quantitative Analyst with R track. And in the meantime, keep posted for our second post on starting finance with Python and check out the Jupyter notebook of this tutorial.
Computers have transformed work and play, transportation and medicine, entertainment and sports. Yet for all their power, these machines still cannot perform simple tasks that a child can do, such as navigating an unknown room or using a pencil.
The solution is finally coming within reach. It will emerge from the intersection of two major pursuits: the reverse engineering of the brain and the burgeoning field of artificial intelligence. Over the next 20 years, these two pursuits will combine to usher in a new epoch of intelligent machines.
Why do we need to know how the brain works to build intelligent machines? Although machine-learning techniques such as deep neural networks have recently made impressive gains, they are still a world away from being intelligent, from being able to understand and act in the world the way that we do. The only example of intelligence, of the ability to learn from the world, to plan and to execute, is the brain. Therefore, we must understand the principles underlying human intelligence and use them to guide us in the development of truly intelligent machines.
At my company,Numenta, in Redwood City, Calif., we study the neocortex, the brain’s largest component and the one most responsible for intelligence. Our goal is to understand how it works and to identify the underlying principles of human cognition. In recent years, we have made significant strides in our work, and we have identified several features of biological intelligence that we believe will need to be incorporated into future thinking machines.
To understand these principles, we must start with some basic biology. The human brain is similar to a reptile’s brain. Each has a spinal cord, which controls reflex behaviors; a brain stem, which controls autonomic behaviors such as breathing and heart rate; and a midbrain, which controls emotions and basic behaviors. But humans, indeed all mammals, have something reptiles don’t: a neocortex.
The neocortex is a deeply folded sheet some 2 millimeters thick that, if laid out flat, would be about as big as a large dinner napkin. In humans, it takes up about 75 percent of the brain’s volume. This is the part that makes us smart.
At birth, the neocortex knows almost nothing; it learns through experience. Everything we learn about the world—driving a car, operating a coffee machine, and the thousands of other things we interact with every day—is stored in the neocortex. It learns what these objects are, where they are in the world, and how they behave. The neocortex also generates motor commands, so when you make a meal or write software it is the neocortex controlling these behaviors. Language, too, is created and understood by the neocortex.
The neocortex, like all of the brain and nervous system, is made up of cells called neurons. Thus, to understand how the brain works, you need to start with the neuron. Your neocortex has about 30 billion of them. A typical neuron has a single tail-like axon and several treelike extensions called dendrites. If you think of the neuron as a kind of signaling system, the axon is the transmitter and the dendrites are the receivers. Along the branches of the dendrites lie some 5,000 to 10,000 synapses, each of which connects to counterparts on thousands of other neurons. There are thus more than 100 trillion synaptic connections.
Your experience of the world around you—recognizing a friend’s face, enjoying a piece of music, holding a bar of soap in your hand—is the result of input from your eyes, ears, and other sensory organs traveling to your neocortex and causing groups of neurons to fire. When a neuron fires, an electrochemical spike travels down the neuron’s axon and crosses synapses to other neurons. If a receiving neuron gets enough input, it might then fire in response and activate other neurons. Of the 30 billion neurons in the neocortex, 1 or 2 percent are firing at any given instant, which means that many millions of neurons will be active at any point in time. The set of active neurons changes as you move and interact with the world. Your perception of the world, what you might consider your conscious experience, is determined by the constantly changing pattern of active neurons.
The neocortex stores these patterns primarily by forming new synapses. This storage enables you to recognize faces and places when you see them again, and also recall them from your memory. For example, when you think of your friend’s face, a pattern of neural firing occurs in the neocortex that is similar to the one that occurs when you are actually seeing your friend’s face.
Remarkably, the neocortex is both complex and simple at the same time. It is complex because it is divided into dozens of regions, each responsible for different cognitive functions. Within each region there are multiple layers of neurons, as well as dozens of neuron types, and the neurons are connected in intricate patterns.
The neocortex is also simple because the details in every region are nearly identical. Through evolution, a single algorithm developed that can be applied to all the things a neocortex does. The existence of such a universal algorithm is exciting because if we can figure out what that algorithm is, we can get at the heart of what it means to be intelligent, and incorporate that knowledge into future machines.
But isn’t that what AI is already doing? Isn’t most of AI built on “neural networks” similar to those in the brain? Not really. While it is true that today’s AI techniques reference neuroscience, they use an overly simplified neuron model, one that omits essential features of real neurons, and they are connected in ways that do not reflect the reality of our brain’s complex architecture. These differences are many, and they matter. They are why AI today may be good at labeling images or recognizing spoken words but is not able to reason, plan, and act in creative ways.
Our recent advances in understanding how the neocortex works give us insights into how future thinking machines will work. I am going to describe three aspects of biological intelligence that are essential, but largely missing from today’s AI. They are learning by rewiring, sparse representations, and embodiment, which refers to the use of movement to learn about the world.
Learning by rewiring: Brains exhibit some remarkable learning properties. First, we learn quickly. A few glances or a few touches with the fingers are often sufficient to learn something new. Second, learning is incremental. We can learn something new without retraining the entire brain or forgetting what we learned before. Third, brains learn continuously. As we move around the world, planning and acting, we never stop learning. Fast, incremental, and continuous learning are essential ingredients that enable intelligent systems to adapt to a changing world. The neuron is responsible for learning, and the complexities of real neurons are what make it a powerful learning machine.
In recent years, neuroscientists have learned some remarkable things about the dendrite. One is that each of its branches acts as a set of pattern detectors. It turns out that just 15 to 20 active synapses on a branch are sufficient to recognize a pattern of activity in a large population of neurons. Therefore, a single neuron can recognize hundreds of distinct patterns. Some of these recognized patterns cause the neuron to become active, but others change the internal state of the cell and act as a prediction of future activity.
Neuroscientists used to believe that learning occurred solely by modifying the effectiveness of existing synapses so that when an input arrived at a synapse it would either be more likely or less likely to make the cell fire. However, we now know that most learning results from growing new synapses between cells—by “rewiring” the brain. Up to 40 percent of the synapses on a neuron are replaced with new ones every day. New synapses result in new patterns of connections among neurons, and therefore new memories. Because the branches of a dendrite are mostly independent, when a neuron learns to recognize a new pattern on one of its dendrites, it doesn’t interfere with what the neuron has already learned on other dendrites.
This is why we can learn new things without interfering with old memories and why we don’t have to retrain the brain every time we learn something new. Today’s neural networks don’t have these properties.
Intelligent machines don’t have to model all the complexity of biological neurons, but the capabilities enabled by dendrites and learning by rewiring are essential. These capabilities will need to be in future AI systems.
Sparse representations: Brains and computers represent information quite differently. In a computer’s memory, all combinations of 1s and 0s are potentially valid, so if you change one bit it will typically result in an entirely different meaning, in much the same way that changing the letter i to a in the word fire results in an unrelated word, fare. Such a representation is therefore brittle.
Brains, on the other hand, use what’s called sparse distributed representations, or SDRs. They’re called sparse because relatively few neurons are fully active at any given time. Which neurons are active changes moment to moment as you move and think, but the percentage is always small. If we think of each neuron as a bit, then to represent a piece of information the brain uses thousands of bits (many more than the 8 to 64 used in computers), but only a small percentage of the bits are 1 at any time; the rest are 0.
Let’s say you want to represent the concept of “cat” using an SDR. You might use 10,000 neurons of which 100 are active. Each of the active neurons represents some aspect of a cat, such as “pet,” or “furry,” or “clawed.” If a few neurons die, or a few extra neurons become active, the new SDR will still be a good representation of “cat” because most of the active neurons are still the same. SDRs are thus not brittle but inherently robust to errors and noise. When we build silicon versions of the brain, they will be intrinsically fault tolerant.
There are two properties of SDRs I want to mention. One, the overlap property, makes it easy to see how two things are similar or different in meaning. Imagine you have one SDR representing “cat” and another representing “bird.” Both the “cat” and “bird” SDR would have the same active neurons representing “pet” and “clawed,” but they wouldn’t share the neuron for “furry.” This example is simplified, but the overlap property is important because it makes it immediately clear to the brain how the two objects are similar or different. This property confers the power to generalize, a capability lacking in computers.
The second, the union property, allows the brain to represent multiple ideas simultaneously. Imagine I see an animal moving in the bushes, but I got only a glimpse, so I can’t be sure of what I saw. It might be a cat, a dog, or a monkey. Because SDRs are sparse, a population of neurons can activate all three SDRs at the same time and not get confused, because the SDRs will not interfere with one another. The ability of neurons to constantly form unions of SDRs makes them very good at handling uncertainty.
Such properties of SDRs are fundamental to understanding, thinking, and planning in the brain. We can’t build intelligent machines without embracing SDRs.
Embodiment: The neocortex receives input from the sensory organs. Every time we move our eyes, limbs, or body, the sensory inputs change. This constantly changing input is the primary mechanism the brain uses to learn about the world. Imagine I present you with an object you have never seen before. For the sake of discussion, let’s say it’s a stapler. How would you learn about the new object? You might walk around the stapler, looking at it from different angles. You might pick it up, run your fingers over it, and rotate it in your hands. You then might push and pull on it to see how it behaves. Through this interactive process, you learn the shape of the stapler, what it feels like, what it looks like, and how it behaves. You make a movement, see how the inputs change, make another movement, see how the inputs change again, and so on. Learning through movement is the brain’s primary means for learning. It will be a central component of all truly intelligent systems.
This is not to say that an intelligent machine needs a physical body, only that it can change what it senses by moving. For example, a virtual AI machine could “move” through the Web by following links and opening files. It could learn the structure of a virtual world through virtual movements, analogous to what we do when walking through a building.
This brings us to an important discovery we made at Numenta last year. In the neocortex, sensory input is processed in a hierarchy of regions. As sensory input passes from one level of the hierarchy to another, more complex features are extracted, until at some point an object can be recognized. Deep-learning networks also use hierarchies, but they often require 100 levels of processing to recognize an image, whereas the neocortex achieves the same result with just four levels. Deep-learning networks also require millions of training patterns, while the neocortex can learn new objects with just a few movements and sensations. The brain is doing something fundamentally different than a typical artificial neural network, but what?
Hermann von Helmholtz, the 19th-century German scientist, was one of the first people to suggest an answer. He observed that, although our eyes move three to four times a second, our visual perception is stable. He deduced that the brain must take account of how the eyes are moving; otherwise it would appear as if the world were wildly jumping about. Similarly, as you touch something, it would be confusing if the brain processed only the tactile input and didn’t know how your fingers were moving at the same time. This principle of combining movement with changing sensations is called sensorimotor integration. How and where sensorimotor integration occurs in the brain is mostly a mystery.
Our discovery is that sensorimotor integration occurs in every region of the neocortex. It is not a separate step but an integral part of all sensory processing. Sensorimotor integration is a key part of the “intelligence algorithm” of the neocortex. We at Numenta have a theory and a model of exactly how neurons do this, one that maps well onto the complex anatomy seen in every neocortical region.
What are the implications of this discovery for machine intelligence? Consider two types of files you might find on a computer. One is an image file produced by a camera, and the other is a computer-aided design file produced by a program such as Autodesk. An image file represents a two-dimensional array of visual features. A CAD file also represents a set of features, but each feature is assigned a location in three-dimensional space. A CAD file models complete objects, not how the object appears from one perspective. With a CAD file, you can predict what an object will look like from any direction and determine how an object will interact with other 3D objects. You can’t do these with an image file. Our discovery is that every region of the neocortex learns 3D models of objects much like a CAD program. Every time your body moves, the neocortex takes the current motor command, converts it into a location in the object’s reference frame, and then combines the location with the sensory input to learn 3D models of the world.
In hindsight, this observation makes sense. Intelligent systems need to learn multidimensional models of the world. Sensorimotor integration doesn’t occur in a few places in the brain; it is a core principle of brain function, part of the intelligence algorithm. Intelligent machines also must work this way.
These three fundamental attributes of the neocortex—learning by rewiring, sparse distributed representations, and sensorimotor integration—will be cornerstones of machine intelligence. Future thinking machines can ignore many aspects of biology, but not these three. Undoubtedly, there will be other discoveries about neurobiology that reveal other aspects of cognition that will need to be incorporated into such machines in the future, but we can get started with what we know today.
From the earliest days of AI, critics dismissed the idea of trying to emulate human brains, often with the refrain that “airplanes don’t flap their wings.” In reality, Wilbur and Orville Wright studied birds in detail. To create lift, they studied bird-wing shapes and tested them in a wind tunnel. For propulsion, they went with a nonavian solution: propeller and motor. To control flight, they observed that birds twist their wings to bank and use their tails to maintain altitude during the turn. So that’s what they did, too. Airplanes still use this method today, although we twist only the tail edge of the wings. In short, the Wright brothers studied birds and then chose which elements of bird flight were essential for human flight and which could be ignored. That’s what we’ll do to build thinking machines.
As I consider the future, I worry that we are not aiming high enough. While it is exciting for today’s computers to classify images and recognize spoken queries, we are not close to building truly intelligent machines. I believe it is vitally important that we do so. The future success and even survival of humanity may depend on it. For example, if we are ever to inhabit other planets, we will need machines to act on our behalf, travel through space, build structures, mine resources, and independently solve complex problems in environments where humans cannot survive. Here on Earth, we face challenges related to disease, climate, and energy. Intelligent machines can help. For example, it should be possible to design intelligent machines that sense and act at the molecular scale. These machines would think about protein folding and gene expression in the same way you and I think about computers and staplers. They could think and act a million times as fast as a human. Such machines could cure diseases and keep our world habitable.
In the 1940s, the pioneers of the computing age sensed that computing was going to be big and beneficial, and that it would likely transform human society. But they could not predict exactly how computers would change our lives. Similarly, we can be confident that truly intelligent machines will transform our world for the better, even if today we can’t predict exactly how. In 20 years, we will look back and see this as the time when advances in brain theory and machine learning started the era of true machine intelligence.
Jeff Hawkins is the cofounder of Numenta, a Redwood City, Calif., company that aims to reverse engineer the neocortex.
What do you need to be happy? If you’ve read a few articles about the roots of happiness, you are probably–and correctly–resisting the urge to say “more money.” Despite our intuition that being richer would doubtlessly make us happier, additional wealth actually does not bring much additional happiness. It’s due to acclimation; we simply adjust to a new norm.
In Richard Wiseman’s 59 Seconds, he examines this fact, and several other mis-held beliefs about the origins of happiness. The book is worth reading for the analysis and summary of scientific findings alone, but Wiseman goes one step further and delivers practical advice on how to leverage the literature in your daily life. True to the title, most of the exercises he proposes take only a minute of your time, and have been proven (in the experimental setting, at least) to markedly increase happiness and satisfaction.
A 5-Day Plan
One such proposal centers around consistent, short, writing exercises. In several psychology studies, weekly writing exercises were shown to increase an individual’s level of happiness. Wiseman broke down five groups of studies into a set of five daily writing tasks you can administer yourself. Each day has its own theme, and a pretty solid reasoning behind the theme. The time investment is minimal, and the overall effect (especially over a time frame of a month or a year) is substantial.
The whole “low time, high benefit” angle immediately sparked my suspicion, but I’m trying to maintain both a healthy optimism and a healthy skepticism towards the whole thing. At the very least, I hope to illustrate and explain Wiseman’s 5-day play, and the reasoning behind it. I’ll even be trying it out myself, perhaps saving the anecdotal results for a future piece.
The overall theme of Wiseman’s plan is fostering a “gratitude attitude”. It rhymes, but it’s nonetheless pretty legit. As always, our “new plan for a new me” begins on the most beginning-est of days–Monday.
Monday: Thanksgiving
Psychologists Emmons and McCullough set out to experimentally determine if we can overcome the acclimation to things that make us happy. One group of probably-white-college-students was instructed to spend one day a week writing about five things for which they felt gratitude. Another group had the unfortunate task of writing down five things that bothered them. The control group had only to detail five things that happened in the past week. Despite feeling more optimistic about the future, the group that had written down things for which they were grateful also were physically healthier after five weeks.
Taking these results, the exercise for Monday is to write down three things that you’re thankful for in your life:
There are many things in your life for which to be grateful. These might include having good friends, being in a wonderful relationship, benefiting from sacrifices that others have made for you, being part of a supportive family, and enjoying good health, a nice home, or enough on the table. Alternatively, you might have a job that you love, have happy memories of the past, or recently have had a nice experience, such as savoring an especially lovely cup of coffee, enjoying the smile of a stranger, having your dog welcome you home, eating a great meal, or stopping to smell the flowers.
I particularly liked Wiseman’s focus on the little things. It is easy to take small comforts for granted, and spending a bit of time reflecting on some of those comforts you enjoy can work to counteract that.
Tuesday: Terrific Times
Have you heard that most people are happier when they spend money on experiences, as opposed to possessions? One of the theories on why this seems to be the case hinges on the plasticity of memory. After a fun vacation, when we reflect back on it, we are far less likely to remember the stuff that wasn’t good–the stress of travel, the getting lost, the errant argument, the sunburn–and instead focus on all the positives from the vacation. Thinking back to relaxing on the beach, reading a good book, visiting the trendy nightclubs, or boozy fornicating at the Four Seasons will give us much more happiness over time than the new TV we have to replace in two years, or the car that keeps needing expensive maintenance.
For Tuesday, take advantage of your rose-tinted glasses and remember an event or experience that was particularly great for you:
Perhaps [there was] a moment when you felt suddenly contented, were in love, listened to an amazing piece of music, saw an incredible performance, or had a great time with friends. Choose just one experience and imagine yourself back in that moment in time. Remember how you felt and what was going on around you. Now spend a few moments writing a description of that experience and how you felt.
Wiseman goes on to state you shouldn’t worry about proper grammar or spelling–something that is true for all of these prompts. I would go as far to say you shouldn’t even spend too much effort congealing your thoughts into something that makes complete sense later. The important part is to spend time focusing on the nice feeling you had, and put pen to paper. Writing utilizes a very specific part of your brain, and for whatever reason, putting your happy thoughts through that neural pathway does more for your happiness than just recollecting freely.
Wednesday: Future Fantastic
This was my favorite alliterative brush stroke in the plan. For the midweek exercise, Wiseman pulls from the tried-and-kind-of-true self-help manifesto of “positive visualization.” Imagine how you want to act and feel, and you can achieve. Though research doesn’t give much support that this kind of visualization is helpful in changing behaviors (and, in fact, in large doses can reduce happiness as the ideal is consistently out of reach), a bit of wishful thinking can actually make you happier.
Quoth Wiseman (emphasis mine):
Spend a few moments writing about your life in the future. Imagine that everything has gone really well. Be realistic, but imagine that you have worked hard and achieved all of your aims and ambitions. Imagine that you have become the person that you really want to be, and that your personal and professional life feels like a dream come true. All of this may not help you achieve your goals, but it will help you feel good and put a smile on your face.
Laura King conducted studies that proved that both imaging an ideal you and remembering your best moments makes you significantly happier. In her experiment on the former, she broke her volunteers into three groups. The first spent a few minutes in four consecutive days describing what it would be like if they achieved all their wildest dreams and goals. A control group took that time each day and wrote about their plans for the day. And, true to form, there was an unlucky third group that had to spend that team each day reliving a traumatic event that had happened to them. The people in the first group wound up substantially happier than the other two groups, and god knows how those souls in the third group felt.
Thursday: Dear…
To study the causal relationship between loving relationships and physical and psychological health, Kory Floyd from Arizona State University devised an experiment. Two groups of probably-white-college-students were assembled. The first group spent twenty minutes writing about why somebody special in their life was so important to them. The control group spent that time writing about something that happened to them over the past week. Each group repeated the exercise three times over a five-week period. Wiseman states that “once again, this simple procedure had a dramatic effect.” Not only was the experimental group significantly happier than the control–they even saw a significant decrease in cholesterol levels.
While it may not be the best plan for a healthy heart, spending a few minutes on Thursday to ruminate on a lovely presence in your life can’t be a bad thing. Wiseman advises:
Think about someone in your life who is very important to you. It might be your partner, a close friend, or a family member. Imagine that you have only one opportunity to tell this person how important they are to you. Write a short letter to this person, describing how much you care for them and the impact they have had on your life.
If appropriate, it may even be nice to give this person a copy of the letter when you’re done, but I’ll leave that up to you.
Friday: Reviewing the Situation
The last daily assignment reflects more on the immediate past. What was nice about last week? Honestly it kind of felt like this one was just added to round out the set, but it definitely fits in the theme of maintaining a feeling of gratitude. And, it’s nice to remember that even if you felt your week was pretty crappy, there were at least some things that went well!
I do once again like Wiseman’s equal focus on the seemingly nondescript and the obvious pie-in-the-sky moments:
Think back over the past seven days and make a note of three things that went really well for you. The events might be fairly trivial, such as finding a space, or more important, such as being offered a new job or opportunity. Jot down a sentence about why you think each event turned out so well.
Emphasis mine. Though I’m sure it can be overwhelming to look at all of these daily tasks and worry about how you can fit it in to your busy schedule, it’s important to keep small scope in mind. Wiseman isn’t advising paragraphs, or even sentences. Think of this as an extra tweet or two, if you’re into that sort of thing.
Getting Started
I’m going to try this thing out and see how it goes, and then maybe I’ll be able to suggest it a bit more whole-heartedly. If you’re interested in more of this type of approach to evaluating and shifting your lifestyle, I’d recommend reading the entire book, which I’m still getting through.
Finally, I have to give credit to this tweet for starting this whole endeavor:
Atwood is somebody I respect in the tech community. If you agree, maybe you’ll feel more inclined to read Wiseman’s work after reading his testimonial (as I did).
Why does this self-help book work when so many others fail? In a word, science! The author goes out of his way to find actual published scientific research documenting specific ways we can make small changes in our behavior to produce better outcomes for ourselves and those around us. It’s powerful stuff, and the book is full of great, research backed insights. I have changed a few of my own behaviors based on the data and science presented in this book.
‘Nuff said. If you want to read more about the psychology studies that prompted Wiseman’s suggestions, check out these resources:
Base65536 is a binary encoding optimised for UTF-32-encoded text and Twitter. This JavaScript module, base65536, is the first implementation of this encoding.
Efficiency ratings are averaged over long inputs. Higher is better.
For example, using Base64, up to 105 bytes of binary data can fit in a Tweet. With Base65536, 280 bytes are possible.
Base65536 uses only "safe" Unicode code points - no unassigned code points, no whitespace, no control characters, etc.. For details of how these code points were selected and why they are thought to be safe, see the sibling project base65536gen.
Encodes a Buffer and returns a Base65536 String, suitable for passing safely through almost any "Unicode-clean" text-handling API. This string contains no special characters and is immune to Unicode normalization. The string encodes two bytes per code point.
Note
While you might expect that the length of the resulting string is half the length of the original buffer, this is only true when counting Unicode code points. In JavaScript, a string's length property reports not the number of code points but the number of 16-bit code units in the string. For characters outside of the Basic Multilingual Plane, a surrogate pair of 16-bit code units is used to represent each code point. base65536 makes extensive use of these characters: 37,376, or about 57%, of the 65,536 code points are chosen from these Supplementary Planes.
As a worked example:
var buf =newBuffer([255, 255]); // two bytesvar str =base65536.encode(buf); // "𨗿", one code point, U+285FFconsole.log(str.length); // 2, two 16-bit code unitsconsole.log(str.charCodeAt(0)); // 55393 = 0xD861console.log(str.charCodeAt(1)); // 56831 = 0xDDFFconsole.log(str ==='\uD861\uDDFF'); // true
base65536.decode(str[, ignoreGarbage])
Decodes a Base65536 String and returns a Buffer containing the original binary data.
By default this function is very strict, with no tolerance for whitespace or other unexpected characters. An Error is thrown if the supplied string is not a valid Base65536 text, or if there is a "final byte" code point in the middle of the string. Set ignoreGarbage to true to ignore non-Base65536 characters (line breaks, spaces, alphanumerics, ...) in the input.
HATETRIS has four buttons: left, right, down and rotate. A single move in HATERIS therefore encodes two bits of information. At present, replays are encoded as hexadecimal and spaced for legibility/selectability. Although a game of HATETRIS may extend for an arbitrary number of keystrokes (simply press rotate forever), in general, the longer the game goes on, the higher one's score.
The world record HATETRIS replay (30 points) is 1,440 keystrokes = 2,880 bits long. At present, HATETRIS replays are encoded as hexadecimal, with each hexadecimal digit encoding 4 bits = 2 keystrokes, and spaces added for clarity/legibility, then presented as text, like so:
That's 899 characters including spaces, or 720 characters if the spaces were removed. Were the hexadecimal characters converted to binary, I would have 360 bytes, and were the binary expressed in Base64, I would have 480 characters.
Using elementary run-length encoding, with two bits of keystroke and two bits of run length, I get down to 2040 bits. That's 255 bytes, which is still 340 characters of Base64. But in Base65536 this is 128 code points! Much better.
And of course, the worse you are at HATETRIS, the shorter your replay is, and the more room you have for invective.
Unicode has 1,114,112 code points, most of which we aren't using. Can we go further?
Not yet.
To encode one additional bit per character, or 140 additional bits (37.5 additional bytes) per Tweet, we need to double the number of code points we use from 65,536 to 131,072. This would be a new encoding, Base131072, and its UTF-32 encoding efficiency would be 53% vs. 50% for Base65536. (Note that in UTF-16, Base32768 significantly outperforms either choice, and in UTF-8, Base64 remains the preferred choice.)
However, as of Unicode 8.0, base65536gen returns only 92,240 safe characters from the "Letter, Other" General Category. Modifying it to add other safe General Categories (all the Letter, Number and Symbol GCs) yields only 101,064 safe characters. A similar calculation for Unicode 9.0 is forthcoming but the numbers still aren't high enough.
Perhaps future versions of Unicode will assign more characters and make this possible.
License
MIT
In other languages
Several people have ported Base65536 from JavaScript to other programming languages.

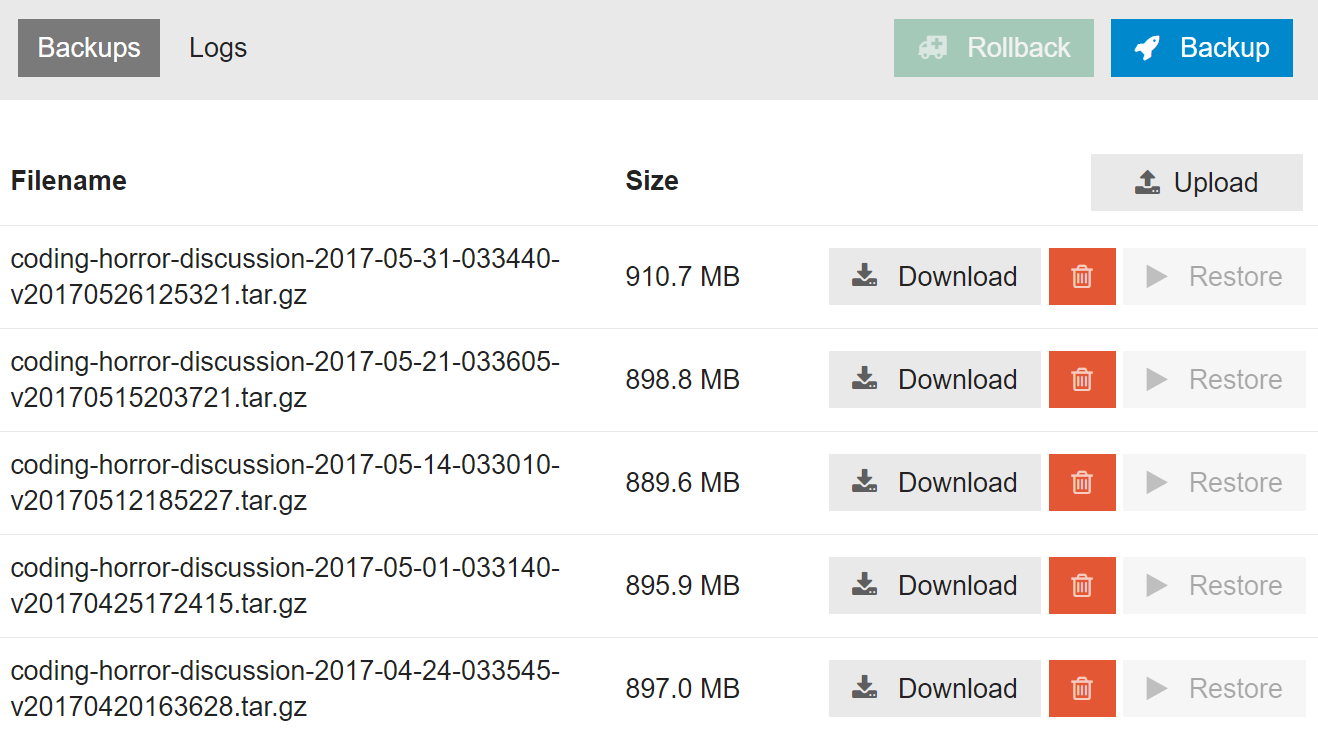
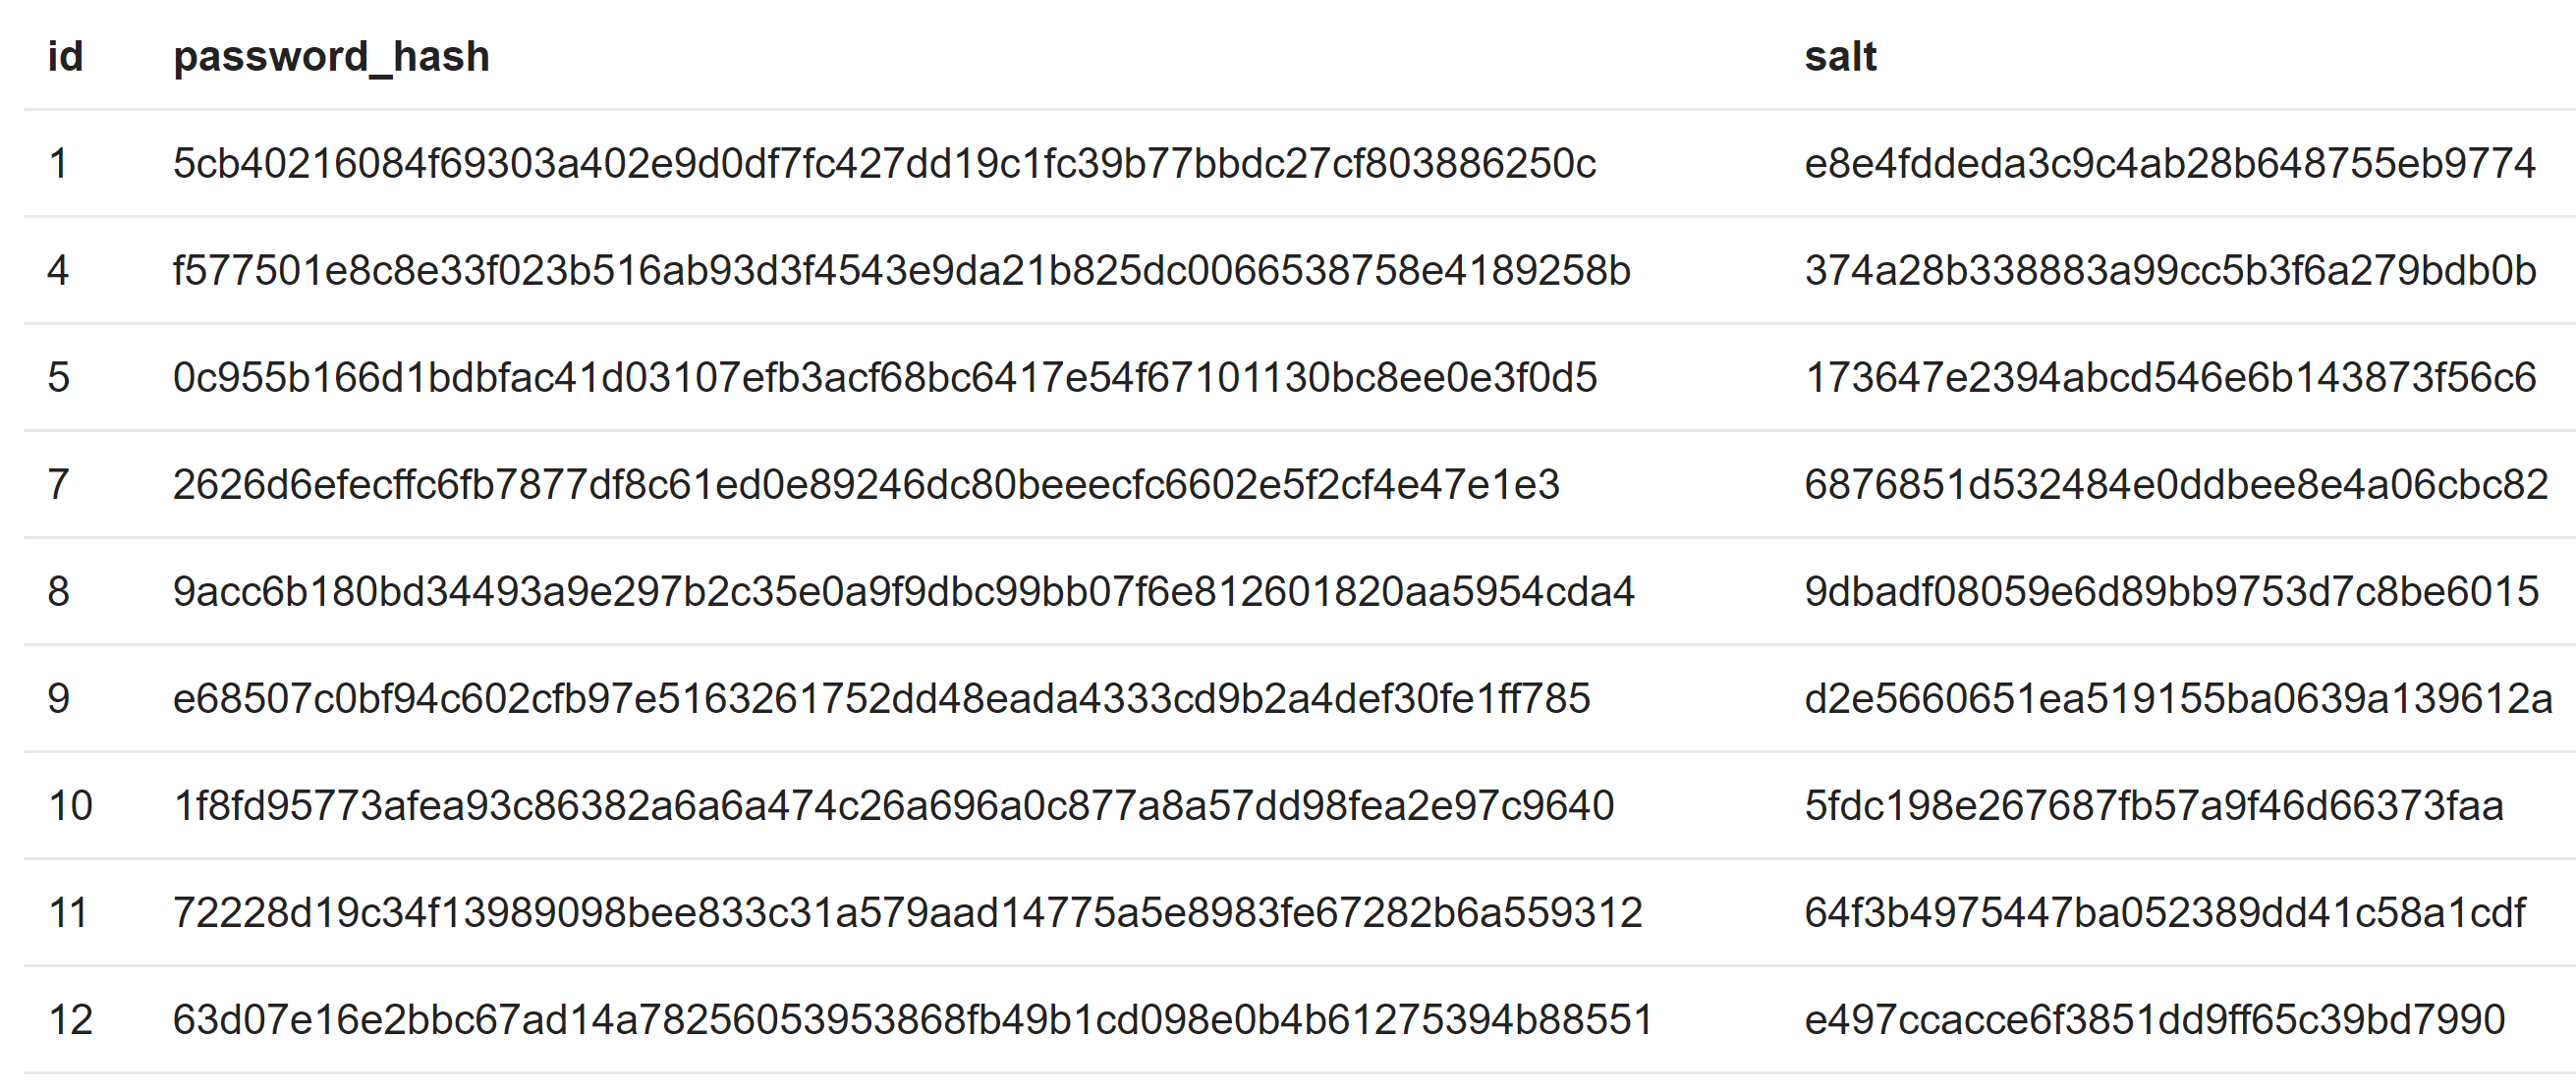


![Rotate[ArrayPlot[CellularAutomaton[135, {{1},0},40],Mesh->True],-45 Degree]](http://blog.stephenwolfram.com/data/uploads/2017/05/RotateArrayPlotCellularAutomaton135-1040Mesh-True-45-Degree.png "Rotate[ArrayPlot[CellularAutomaton[135, {{1},0},40],Mesh->True],-45 Degree]")
![Rotate[ArrayPlot[CellularAutomaton[135, {{1},0},40],Mesh->True],-45 Degree], PlotRange->{{83,104},{-12,60}}]](http://blog.stephenwolfram.com/data/uploads/2017/05/RotateArrayPlotCellularAutomaton135-1040Mesh-True-45-Degree-PlotRange-83104-1260.png "Rotate[ArrayPlot[CellularAutomaton[135, {{1},0},40],Mesh->True],-45 Degree], PlotRange->{{83,104},{-12,60}}]")


 institutions such as banks to control the flow of wealth. The digital exchange companies that serve as “trusted third parties” are the main control points for bitcoin. That’s the point at which privacy is stripped from users, and the transfer of wealth can be closely monitored. For regulations to work, therefore, users must be herded toward trusted third parties who function as an arm of the government.
 trading bitcoin for years. At first, the purchase of bitcoin was apparently conducted through digital currency exchanges such as Coinbase and Bitstamp, with the sale occurring on
  been selectively prosecuted due to their prominence in order to send a warning to others. The Springfield Business Journal (May 15) reported that “many [in the community] were left in disbelief and confusion after…Jason Klein pleaded guilty to a federal charge for selling bitcoin.” Klein is “president of the Association of Information Technology Professionals’ Ozarks chapter, and was elected to serve this year on the leadership council of The Network, the chamber’s group for young professionals.” He also faces up to five years in prison and/or a $250,000 fine.
 out. A May 6 headline in the Miami Herald stated, “Florida criminals who use bitcoins could now face money-laundering charges.” Those arrested do not need to deal drugs, sell sex or commit fraud, of course. Merely being unlicensed is a crime.
 freedom, it must eschew the trusted third party approach because those parties almost always interact with government agencies in much the same manner as central banks do. They strip away privacy from customers and report on their financial practices.