htop is an interactive process monitor. It’s one of my favorite linux tools that I use regularly to monitor system resources. If you take top and put it on steroids, you get htop.

htop has an awesome visual interface that you can also interact with using your keyboard. The screen packs a lot of information which can be daunting to look at. I tried to find a nice infographic to explain what each number, value or color coded bars mean, but couldn’t find any. Hence I decided to make one myself over the Christmas break.
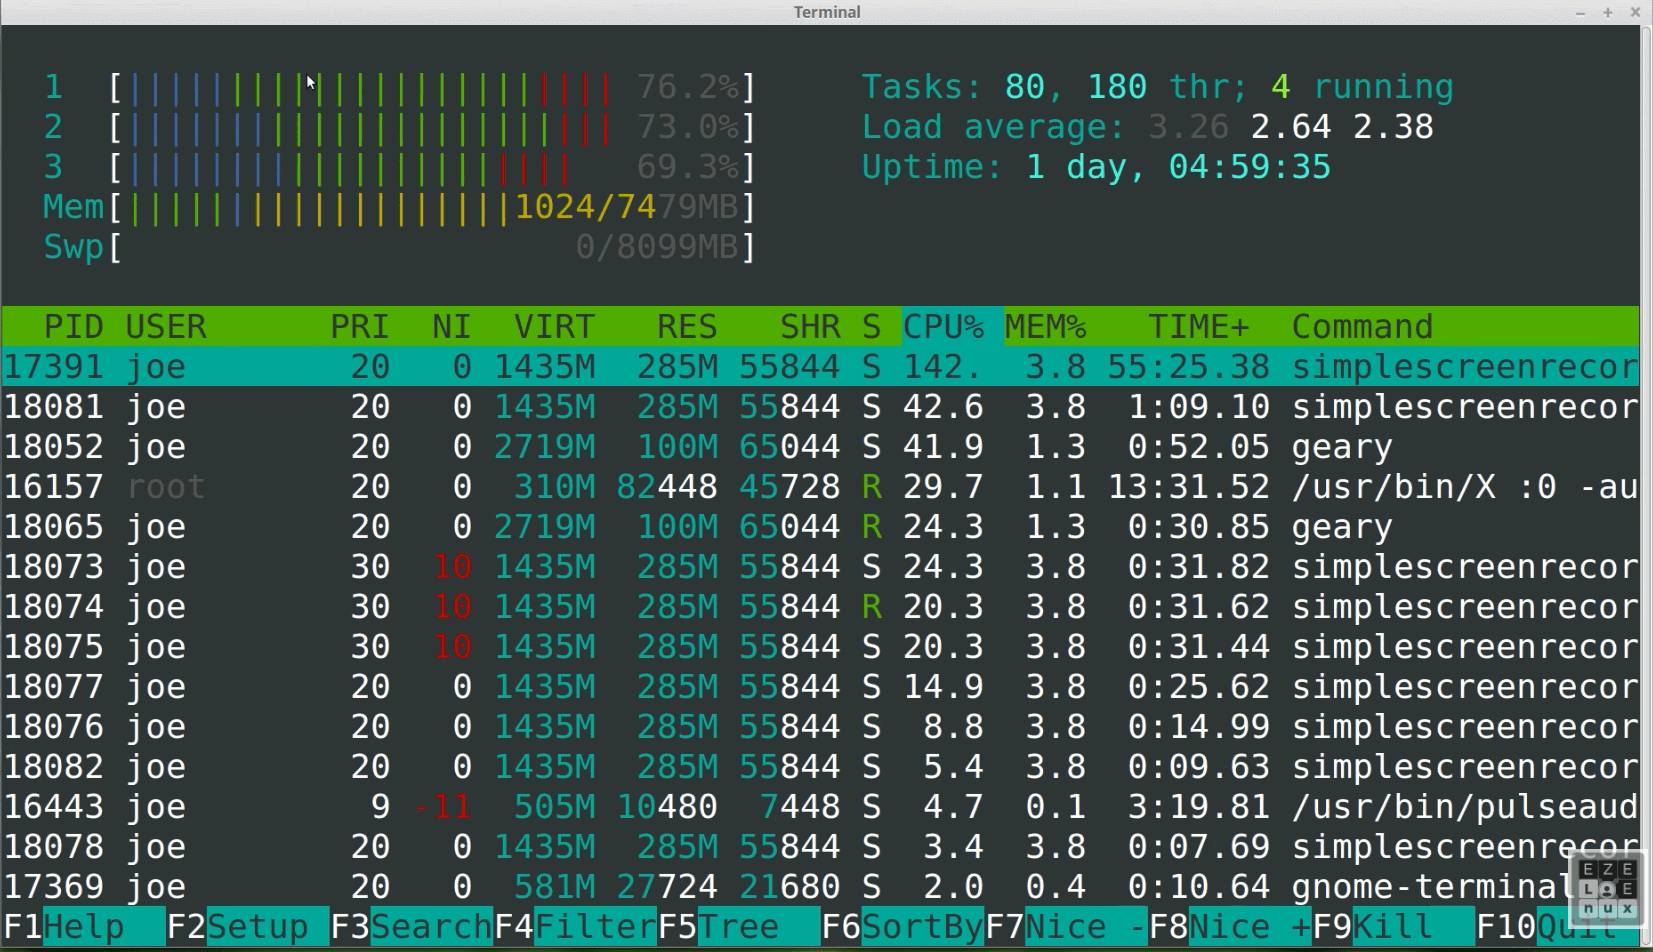
Here’s what htop looks like when you first run it. (Image courtesy of Joe Collins):

I’ve separated the interface into upper and lower sections so I have enough room to annotate.
Let’s start with the upper section.

Here’s the lower section of htop.

I hope you found this post useful. Until next time.