Nov 10, 2016
In my last infrastructure update, I documented our challenges with storage as GitLab scales. We built a CephFS cluster to tackle both the capacity and performance issues of NFS and decided to replace PostgreSQL standard Vacuum with the pg_repack extension. Now, we're feeling the pain of running a high performance distributed filesystem on the cloud.
Over the past month, we loaded a lot of projects, users, and CI artifacts onto CephFS. We chose CephFS because it's a reliable distributed file system that can grow capacity to the petabyte, making it virtually infinite, and we needed storage. By going with CephFS, we could push the solution into the infrastructure instead of creating a complicated application. The problem with CephFS is that in order to work, it needs to have a really performant underlaying infrastructure because it needs to read and write a lot of things really fast. If one of the hosts delays writing to the journal, then the rest of the fleet is waiting for that operation alone, and the whole file system is blocked. When this happens, all of the hosts halt, and you have a locked file system; no one can read or write anything and that basically takes everything down.

What we learned is that when you get into the consistency, accessibility, and partition tolerance (CAP) of CephFS, it will just give away availability in exchange for consistency. We also learned that when you put a lot of pressure on the system, it will generate hot spots. For example, in specific places in the cluster of machines hosting the GitLab CE repo, all the reads and writes end up being on the same spot during high load times. This problem is amplified because we hosted the system in the cloud where there is not a minimum SLA for IO latency.
Performance Issues on the Cloud
By choosing to use the cloud, we are by default sharing infrastructure with a lot of other people. The cloud is timesharing, i.e. you share the machine with others on the providers resources. As such, the provider has to ensure that everyone gets a fair slice of the time share. To do this, providers place performance limits and thresholds on the services they provide.
On our server, GitLab can only perform 20,000 IOPS but the low limit is 0. With this performance capacity, we became the "noisy neighbors" on the shared machines, using all of the resources. We became the neighbor who plays their music loud and really late. So, we were punished with latencies. Providers don't provide a minimum IOPS, so they can just drop you. If we wanted to make the disk reach something, we would have to wait 100 ms latency. That's basically telling us to wait 8 years. What we found is that the cloud was not meant to provide the level of IOPS performance we needed to run an agressive system like CephFS.
At a small scale, the cloud is cheaper and sufficient for many projects. However, if you need to scale, it's not so easy. It's often sold as, "If you need to scale and add more machines, you can spawn them because the cloud is 'infinite'". What we discovered is that yes, you can keep spawning more machines but there is a threshold in time, particulary when you're adding heavy IOPS, where it becomes less effective and very expensive. You'll still have to pay for bigger machines. The nature of the cloud is time sharing so you still will not get the best performance. When it comes down to it, you're paying a lot of money to get a subpar level of service while still needing more performance.
So, what happens when the cloud is just not enough?
At this point, moving to dedicated hardware makes sense for us. From a cost perspective, it is more economical and reliable because of how the culture of the cloud works and the level of performance we need. Of course hardware comes with it's upfront costs: components will fail and need to be replaced. This requires services and support that we currently don't have today. You have to know the hardware you are getting into and put a lot more effort into keeping it alive. But in the long run, it will make GitLab more efficient, consistent, and reliable as we will have more ownership of the entire infrastructure.
How We Proactively Uncover Issues
At GitLab, we are able to proactively uncover issues like this because we are building an observable system as a way to understand how our system behaves. The machine is doing a lot of things, most of which we are not even aware of. To get a deeper look at what's happening, we gather data and metrics into Prometheus to build dashboards and observe trends.
These metrics are in the depth of the kernel and not readily visible to humans. To see it, you need to build a system that allows you to pull, aggregate, and graph this data in a way you can see it. Graphs are great because you can get a lot of data in one screen and read it with a simple glance.
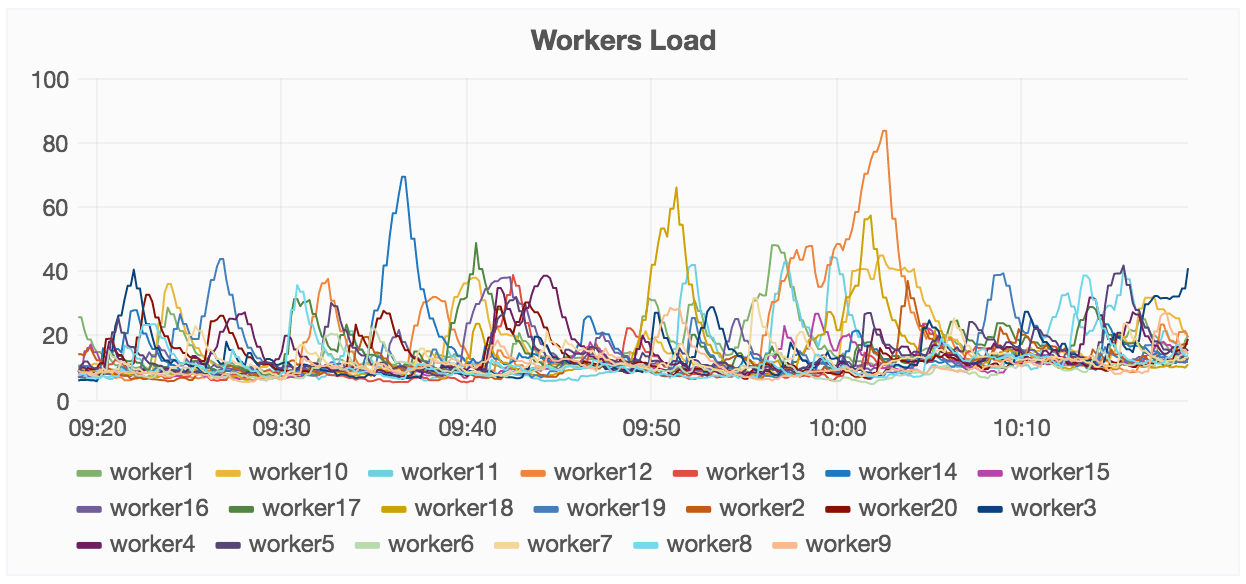
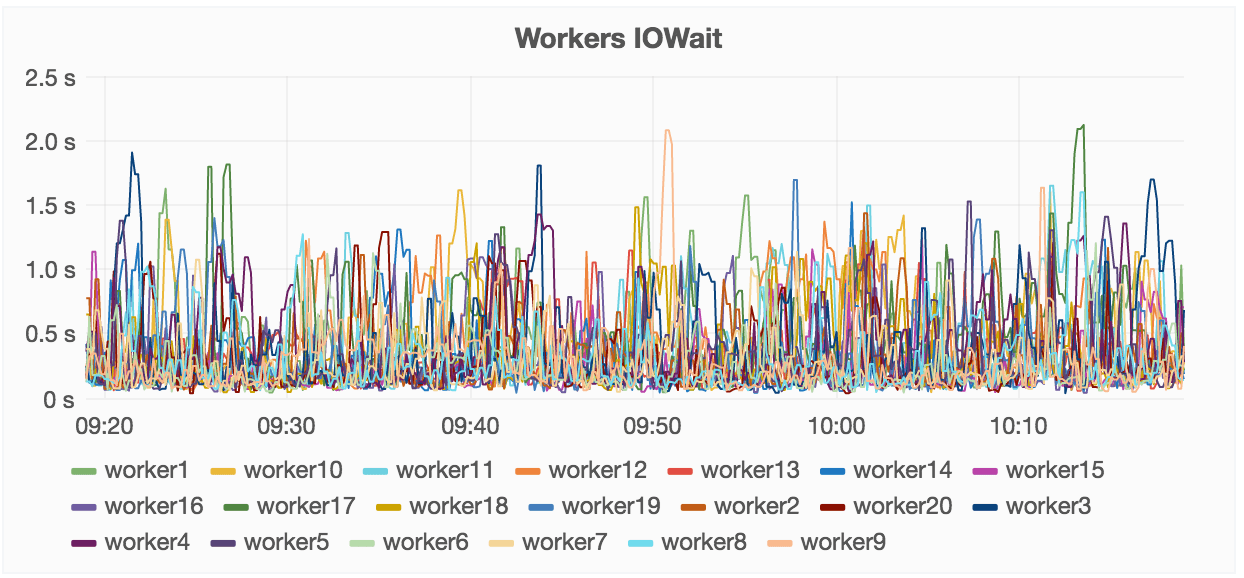
For example, our fleet overview dashboard shows how many different workers are performing in one view:


How we used our dashboard to understand CephFS in the cloud
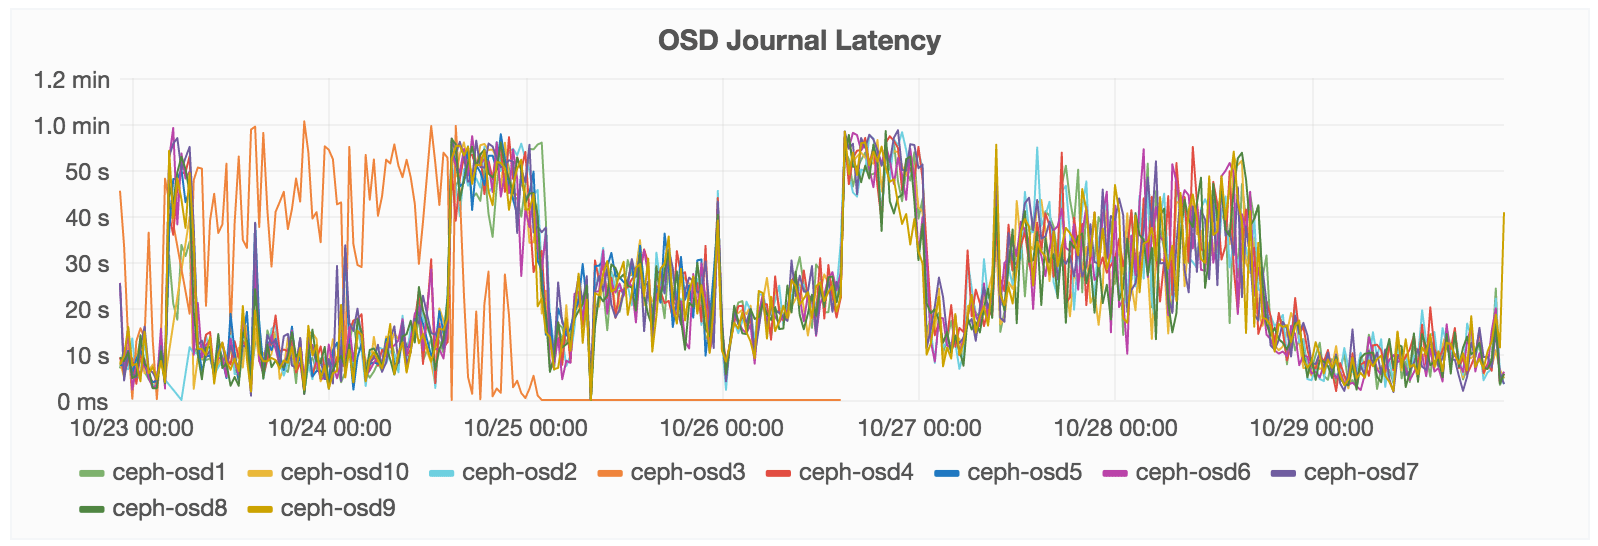
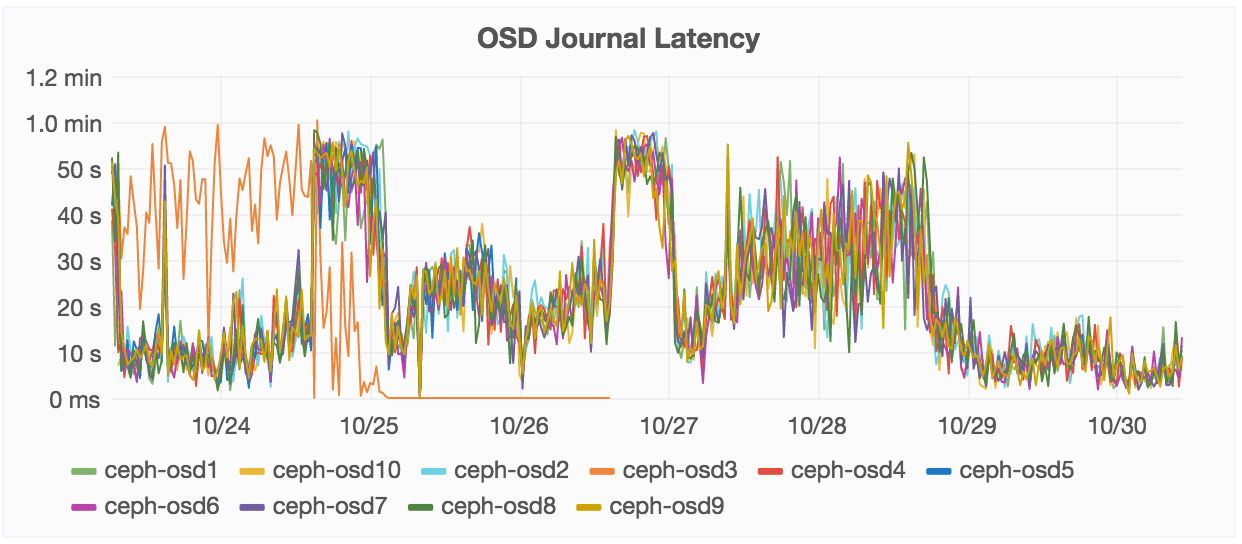
Below, you can see OSD Journal Latency. You can see how, over the last 7 days shown, we had a spike.

This is how much time we spent trying to write to this journal disk. In general, we roughly perform commit data to this journal within 2 to 12 seconds. You can see where it jumps to 42 seconds to complete – that delay is where we are being punished. The high spikes show GitLab.com is down.
What's great about having this dashboard is that there is a lot of data available quickly, in one place. Non-technical people can understand this. This is the level of insight into your system you want to aim for. You can build on your own with Prometheus. We have been building this for the last month, it's close to the end state. We're still working on it but to add more things.
This is how we make informed decisions to understand as best as we can what is going on with our infrastructure. What we tend to do is whenever we see a service failing or performing in a way that is unexpected, we pull together a dashboard to highlight the underlaying data to help us understand what's happening, and how things are being impacted on a larger scale. Usually monitoring is an afterthought but we are changing this by shipping more and more detailed and comprehensive monitoring with GitLab. Without detailed monitoring you are just guessing at what is going on within your environment and systems.
The bottom line is that once you have moved beyond a handful of systems it is no longer feasible to run one-off commands to try and understand what is happening within your infrastructure. True insight can only be gained by having enough data to make informed decisions with.
Recap: What We Learned
- CephFS gives us more scalability and ostensibly performance but did not work well in the cloud on shared resources, despite tweaking and tuning it to try to make it work.
- There is a threshold of performance on the cloud and if you need more, you will have to pay a lot more, be punished with latencies, or leave the cloud.
- Moving to dedicated hardware is more economical and reliable for the scale and performance of our application.
- Building an observable system by pulling and aggregating performance data into understandable dashboards helps us spot non-obvious trends and correlations, leading to addressing issues faster.
- Monitoring some things can be really application specific which is why we are building our own gitlab-monitor Prometheus exporter. We plan to ship this with GitLab CE soon.
Install GitLab on your own server in 2 minutes