![]() This text describes the presentation that I gave at the "Peak Summit" in Alcatraz (Italy) on June 27, 2009 (the picture shows me speaking there). It is not a transcription, but something that I wrote from memory, mostly in a single stretch, while I had it still fresh in my mind. The result is that my 40 minutes talk became a text of more than 10,000 words, much longer than a typical internet document (but still less than Gibbon's six volumes on the same subject!) A talk, anyway, can be longer and more effective than a post, mostly because the people listening to you are not distracted by the infinite distractions of an internet connection. So, I wrote this post trying to maintain the style of an oral presentation. I don't know if it will turn out to be more easily readable than the usual style but, if you arrive to the end, you'll tell me what you think of it.
This text describes the presentation that I gave at the "Peak Summit" in Alcatraz (Italy) on June 27, 2009 (the picture shows me speaking there). It is not a transcription, but something that I wrote from memory, mostly in a single stretch, while I had it still fresh in my mind. The result is that my 40 minutes talk became a text of more than 10,000 words, much longer than a typical internet document (but still less than Gibbon's six volumes on the same subject!) A talk, anyway, can be longer and more effective than a post, mostly because the people listening to you are not distracted by the infinite distractions of an internet connection. So, I wrote this post trying to maintain the style of an oral presentation. I don't know if it will turn out to be more easily readable than the usual style but, if you arrive to the end, you'll tell me what you think of it.
Ladies and gentlemen, first of all thank you for being here. This afternoon I'll try to say something about a subject that I am sure you are all interested in: the decline and the fall of the Roman Empire. It is something that has been discussed over and over; it is because we think that our civilization may follow the same destiny as the Roman one: decline and fall. So, the Roman Empire offers us some kind of a model. We can say it is the paradigm of collapsing societies. And, yet, we don't seem to be able to find an agreement on what caused the collapse of the Roman Empire.
Historians - and not just historians - have been debating this subject and they came up with literally dozens of explanations: barbarian invasions, epidemics, lead poisoning, moral decadence and what you have. Which is the right one? Or are all these explanations right? This is the point that I would like to discuss today. I'll be focusing on the interpretation of Joseph Tainter, based on the fact that empires and civilizations are "complex" systems and try to use system dynamics to describe collapse.
Before we go into this matter, however, let me add a disclaimer. I am not a historian and I don't pretend to be one. It is not my intention of criticizing or disparaging the work of historians. You see, there are several ways of making a fool of oneself: one which is very effective is to try teaching to people who know more than you. For some reasons, however, it happens all the time and not just with history; just look at the debate on climate change! So, what I am trying to do here is just to apply system dynamics on the history of the Roman Empire which - as far as I know - has not been done, so far. It is a qualitative version of system dynamics; making a complete model of the whole Roman Empire is beyond my means. But the results are very interesting; or so I believe.
The collapse seen from inside.
Let's start from the beginning and here the beginning is with the people who were contemporary to the collapse, the Romans themselves. Did they understand what was happening to them? This is a very important point: if a society, intended as its government, can understand that collapse is coming, can they do something to avoid it? It is relevant to our own situation, today.
Of course, the ancient Romans are long gone and they didn't leave us newspapers. Today we have huge amounts of documents but, from Roman times, we have very little. All what has survived from those times had to be slowly hand copied by a Medieval monk, and a lot has been lost. We have a lot of texts by Roman historians - none of them seemed to understand exactly what was going on. Historians of that time were more like chroniclers; they reported the facts they knew. Not that they didn't have their ideas on what they were describing, but they were not trying to make models, as we would say today. So, I think it may be interesting to give a look to documents written by people who were not historians; but who were living the collapse of the Roman Empire. What did they think of what was going on?
Let me start with Emperor Marcus Aurelius, who lived from 120 to 180 A.D. He was probably the last Emperor who ruled a strong empire. Yet, he spent most of his life fighting to keep the Empire together; fighting barbarians. Maybe you have seen the movie "The Gladiator": Marcus Aurelius appears in the first scenes. The movie is not historically accurate, of course, but it is true that Aurelius died in the field, while he was fighting invaders. He wasn't fighting for glory, he wasn't fighting to conquer new territories. He was just fighting to keep the Empire together, and he had a terribly hard time just doing that. Times had changed a lot from the times of Caesar and of Trajan.
Marcus Aurelius did what he could to keep the barbarians away but, a few decades after his death, the Empire had basically collapsed. That was what historians call "the third century crisis". It was really bad; a disaster. The empire managed to survive for a couple of centuries longer as a political entity, but it wasn't the same thing. It was not any longer the Empire of Marcus Aurelius; it was something that just tried to survive as best as it could, fighting barbarians, plagues, famines, warlords and all kinds of disasters falling on them one after the other. Eventually, the Empire disappeared also as a political entity. It did that with a whimper - at least in its Western part, in the 5th century a.d. The Eastern Empire lasted much longer, but it is another story.
Here is a piece of statuary from Roman times. We know what Marcus Aurelius looked like.
![]()
Now, if it is rare that we have the portrait of a man who lived so long ago, it is even rarer that we can also read his inner thoughts. But that we can do that with Marcus Aurelius. He was a "philosopher-emperor" who left us his "Meditations"; a book of philosophical thoughts. For instance, you can read such things as:
Though thou shouldst be going to live three thousand years, and as many times ten thousand years, still remember that no man loses any other life than this which he now lives, nor lives any other than this which he now loses.
That is the typical tune of the book - you may find it fascinating or perhaps boring; it depends on you. Personally, I find it fascinating. The "Meditations" is a statement from a man who was seeing his world crumbling down around him and who strove nevertheless to maintain a personal balance; to keep a moral stance. Aurelius surely understood that something was wrong with the Empire: during all their history, the Romans had been almost always on the offensive. Now, they were always defending themselves. That wasn't right; of course.
But you never find in the Meditations a single line that lets you suspect that the Emperor thought that there was something to be done other than simply fighting to keep the barbarians out. You never read that the Emperor was considering, say, things like social reform, or maybe something to redress the disastrous situation of the economy. He had no concern, apparently, that the Empire could actually fall one day or another.
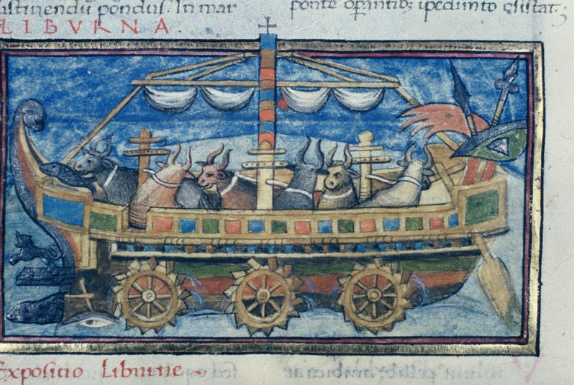
Now, I'd like to show you an excerpt from another document; written perhaps by late 4th century. Probably after the battle of Adrianopolis; that was one of last important battles fought (and lost) by the Roman Empire. This is a curious document. It is called, normally, "Of matters of war" because the title and the name of the author have been lost. But we have the bulk of the text and we can say that the author was probably somebody high up in the imperial bureaucracy. Someone very creative - clearly - you can see that from the illustrations of the book. Of course what we see now are not the original illustrations, but copies made during the Middle Ages. But the fact that the book had these illustration was probably what made it survive: people liked these colorful illustrations and had the book copied. So it wasn't lost. The author described all sorts of curious weaponry. One that you can see here is a warship powered by oxen.
![]()
Of course, a ship like this one would never have worked. Think of how to feed the oxen. And think of how to manage the final results of feeding the oxen. Probably none of the curious weapons invented by our anonymous author would ever have worked. It all reminds me of Jeremy Rifkin and his hydrogen based economy. Rifkin understands what is the problem, but the solutions he proposes, well, are a little like the end result of feeding the oxen; but let me not go into that. The point is that our 4th century author does understand that the Roman Empire is in trouble. Actually, he seems to be scared to death because of what's happening. Read this sentence, I am showing it to you in the original Latin to give you a sense of the flavor of this text.
“In primis sciendum est quod imperium romanum circumlatrantium ubique nationum perstringat insania et omne latus limitum tecta naturalibus locis appetat dolosa barbaries."
Of course you may not be able to translate from Latin on the spot. For that, being Italian gives you a definite advantage. But let me just point out a word to you: "circumlatrantium" . which refers to barbarians who are, literally, "barking around" the empire's borders. They are like dogs barking and running around; and not just barking - they are trying hard to get in. It is almost a scene from a horror movie. A nightmare. So the author of "Of matters of war" is thinking of how to get rid of these monsters. But his solutions were not so good. Actually it was just wishful thinking. None of these strange weapons were ever built. Even our 4th century author, therefore, fails completely in understanding what were the real problems of the Empire.
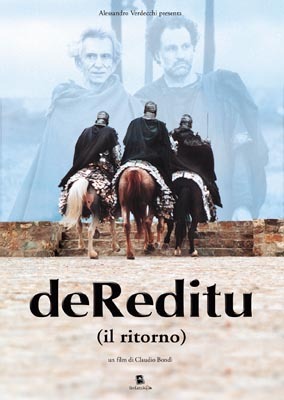
Now, I would like to show you just another document from the time of the Roman Empire. It is "De Reditu suo", by Rutilius Namatianus. The title means "of his return". Namatianus was a patrician who lived in the early 5th century; he was a contemporary of St. Patrick, the Irish saint. He had some kind of job with the imperial administration in Rome. It was some decades before the "official" disappearance of the Western Roman Empire; that was in 476, when the last emperor, Romolus Augustulus, was deposed. You may have seen Romulus Augustulus as protagonist of the movie "The Last Legion".
![]() Of course that is not a movie that pretends to be historically accurate, but it is fun to think that after so many years we are still interested in the last years of the Roman Empire - it is a subject of endless fascination. Even the book by Namatianus has been transformed into a movie, as you can see in the figure. It is a work of fantasy, but they have tried to be faithful to the spirit of Namatianus' report. It must be an interesting movie, but it has been shown only in theaters in Italy, and even there for a very short time; so I missed it. But let's move on.
Of course that is not a movie that pretends to be historically accurate, but it is fun to think that after so many years we are still interested in the last years of the Roman Empire - it is a subject of endless fascination. Even the book by Namatianus has been transformed into a movie, as you can see in the figure. It is a work of fantasy, but they have tried to be faithful to the spirit of Namatianus' report. It must be an interesting movie, but it has been shown only in theaters in Italy, and even there for a very short time; so I missed it. But let's move on.
Namatianus lived at a time that was very close to the last gasp of the Empire. He found that, at some point, it wasn't possible to live in Rome any longer. Everything was collapsing around him and he decided to take a boat and leave. He was born in Gallia, that we call "France" today, and apparently he had some properties there. So, that is where he headed for. That is the reason for the title "of his return". He must have arrived there and survived for some time, because the document that he wrote about his travel has survived and we can still read it, even though the end is missing. So, Namatianus gives us this chilling report. Just read this excerpt:
"I have chosen the sea, since roads by land, if on the level, are flooded by rivers; if on higher ground, are beset with rocks. Since Tuscany and since the Aurelian highway, after suffering the outrages of Goths with fire or sword, can no longer control forest with homestead or river with bridge, it is better to entrust my sails to the wayward."
Can you believe that? If there was a thing that the Romans had always been proud of were their roads. These roads had a military purpose, of course, but everybody could use them. A Roman Empire without roads is not the Roman Empire, it is something else altogether. Think of Los Angeles without highways. "Sic transit gloria mundi" , as the Romans would say; there goes the glory of the world. Namatianus tells us also of silted harbors, deserted cities, a landscape of ruins that he sees as he moves north along the Italian coast.
But what does Namatianus think of all this? Well, he sees the collapse all around him, but he can't understand it. For him, the reasons of the fall of Rome are totally incomprehensible. He can only interpret what is going on as a temporary setback. Rome had hard times before but the Romans always rebounded and eventually triumphed over their enemies. It has always been like this, Rome will become powerful and rich again.
There would be much more to say on this matter, but I think it is enough to say that the Romans did not really understand what was happening to their Empire, except in terms of military setbacks that they always saw as temporary. They always seemed to think that these setbacks could be redressed by increasing the size of the army and building more fortifications. Also, it gives us an idea of what it is like living a collapse "from the inside". Most people just don't see it happening - it is like being a fish: you don't see the water.
The situation seems to be the same with us: talking about the collapse of our civilization is reserved to a small bunch of catastrophists; you know them; ASPO members, or members of The Oil Drum - that kind of people. Incidentally, we can't rule out that at some moment at the time of the Roman Empire there was something like a "Roman ASPO", maybe "ASPE," the "association for the study of peak empire". If it ever existed, it left no trace. That may also happen with our ASPO; actually it is very likely, but let's go on.
What destroyed the Roman Empire?
From our perspective we can see the cycle of the Roman Empire as one that is nicely complete. We can see it from start to end; from the initial expansion to the final collapse. As I said, a lot of documents and data have been lost but, still, we have plenty of information on the Empire - much more than for other past empires and civilizations that collapsed and disappeared as well. Yet, we don't seem to be able to find an agreement on the reasons of the collapse.
You have surely read Edward Gibbon's "Decline and Fall of the Roman Empire"; at least parts of it. Gibbon wrote a truly monumental account of the story of the Empire, but he doesn't really propose us a "theory" of the causes of the fall, as most historians would do, later on. On reading Gibbon's work, you understand that he thinks there was a sort of loss of moral fiber in the Romans. He attributes this loss to the negative effect of Christianity. That is, the noble virtues of the Ancient Romans - he says - had been corrupted by this sect of fanatics coming from the East. This had made the Romans unable to resist to the invading barbarians.
You'll probably agree that this explanation by Gibbon is a bit limited; just as are limited other interpretations by authors who came later. Spengler and Tonybee are two examples, but if we were to discuss their work in detail it would take - well - weeks; not hours. So, let me jump forward to the historian who - I think - has given a new and original interpretation of the decline of Rome: Joseph Tainter with his "The Collapse of Complex Societies". His book was published for the first time in 1990.
It is a great book. I suggest to you to read it and ponder it. It is truly a mine of information about collapses. It doesn't deal just with the Roman Empire, but with many other civilizations. Tainter goes well beyond the simplistic interpretation of many earlier authors and identifies a key point in the question of collapse. Societies are complex entities; he understands that. And, hence, their collapse must be related to complexity. Here is an excerpt of Tainter's way of thinking. It is a transcription of a interview that Tainter gave in the film "Blind Spot" (2008)
In ancient societies that I studied, for example the Roman Empire, the great problem that they faced was when they would have to incur very high costs just to maintain the status quo. Invest very high amounts in solving problems that don't yield a net positive return, but instead simply allowed them to maintain what they already got. This decreases the net benefit of being a complex society.
Here is how Tainter describes his view in graphical form; in his book.
![]()
So, you see that Tainter has one thing very clear: complexity gives a benefit, but it is also a cost. This cost is related to energy, as he makes clear in his book. And in emphasizing complexity, Tainter gives us a good definition of what we intend for collapse. Very often people have been discussing the collapse of ancient societies without specifying what they meant for "collapse". For a while, there has been a school of thought that maintained that the Roman Empire had never really "collapsed". It had simply transformed itself into something else. But if you take collapse defined as "a rapid reduction of complexity" then you have a good definition and that's surely what happened to the Roman Empire.
So, what was important with the collapse of the Roman Empire is not whether or not there was an emperor in Rome (or, as it was the case later, in Ravenna). We might well imagine that the line of the emperors could have continued well after Romulus Augustulus - the last emperor. And even after him there remained a legitimate Roman Emperor in Byzantium, in the Eastern Empire. You could very well say that the Empire didn't disappear as long as there were emperors in Byzantium, that is, until Costantinople fell, in the 15th cenntury. And since the Russian Czars saw themselves as Roman emperors (that is where "Czar" comes from, from "Caesar"), you could say that the Roman Empire didn't disappear until the last Czar was deposed, in 1917. But that is not the point. The point is that the Roman Empire had started undergoing a catastrophic loss of complexity already during the third century. So, that was the real collapse. What happened later on is another story.
After that Tainter has spoken of complexity, and of the energy cost of complexity, it is perhaps surprising for us that he doesn't consider resource depletion as a cause of collapse. Resource depletion, after all, is the main theme of Jared Diamond's book "Collapse". It is how he interprets the collapse of many societies. Tainter explicitly denies that in his book. He says that if such a thing as depletion appears, then society should react against it. After all, it is normal: society always reacts to all kinds of crisis, and why shouldn't it react to resource depletion? This point made by Tainter may appear surprising - actually unpalatable - to people who have made resource depletion the centerpiece of their thought. Peak oilers, for instance.
The disagreement between peak oilers (and Diamond) and Tainter may not be so strong as it appears. That we'll see as we go deeper into the details. But before we do that, let me say something general about these explanations that people give for collapse. It happens all the time that people discover something that they describe as if it was the only cause for collapse. That is, they sort of get enamored of a single cause for collapse. They say, "I have the solution; it is this and nothing else."
Consider the story that Roman Empire collapsed because the Romans used to drink wine in lead goblets; and so they died of lead poisoning. That has some truth: there is evidence of lead poisoning in ancient Roman skeletons; there are descriptions of lead poisoning in ancient Roman texts. Surely it was a problem, probably even a serious one. But you can't see this story of lead poisoning in isolation; otherwise you neglect everything else: the Roman Empire was not just people drinking wine in lead goblets. Think of a historian of the future who describes the fall of the American Empire as the result of Americans eating hamburgers. That would have some truth and for sure the kind of food that most Americans eat today is - well - we know that it is doing a lot of damage to Americans in general. But you wouldn't say that hamburgers can be the cause of the fall of the American Empire. There is much more to that.
The same kind of reasoning holds for other "causes" that have been singled out for the fall of Rome. Think, for instance, of climatic change. Also here, there is evidence that the fall of the Roman Empire was accompanied by droughts. That may surely have been a problem for the Romans. But, again, we might fall in the same mistake of a future historian who might attribute the fall of the American Empire - say - to the hurricane Katrina. (I have nothing special against the American Empire, it is just that it is the current empire)
The point that Tainter makes, quite correctly, in his book is that it is hard to see the fall of such a complex thing as an empire as due to a single cause. A complex entity should fall in a complex manner, and I think it is correct. In Tainter's view, societies always face crisis and challenges of various kinds. The answer to these crisis and challenges is to build up structures - say, bureaucratic or military - in response. Each time a crisis is faced and solved, society finds itself with an extra layer of complexity. Now, Tainter says, as complexity increases, the benefit of this extra complexity starts going down - he calls it "the marginal benefit of complexity". That is because complexity has a cost - it costs energy to maintain complex systems. As you keep increasing complexity, this benefit become negative. The cost of complexity overtakes its benefit. At some moment, the burden of these complex structures is so great that the whole society crashes down - it is collapse.
I think that Tainter has understood a fundamental point, here. Societies adapt to changes. Indeed, one characteristic of complex systems is of adapting to changing external conditions. It is called "homeostasis" and I tend to see it as the defining characteristic of a complex system (as opposed to simply complicated). So, in general, when you deal with complex systems, you should not think in terms of "cause and effect" but, rather, in terms of "forcing and feedback". A forcing is something that comes from outside the system. A feedback is how the system reacts to a forcing, usually attaining some kind of homeostasis. Homeostasis, is a fundamental concept in system dynamics. Something acts on something else, but also that something else reacts. It is feedback. It may be positive (reinforcing) or negative (damping) and we speak of "feedback loops" which normally stabilize systems - within limits, of course.
Homeostasis has to be understood for what it is. It is not at all the same thing as "equilibrium" as it is defined in thermodynamics. For example, a human being is a complex system. When you are alive, you are in homeostasis. If you are in equilibrium, it means that you are dead. Homeostasis is a dynamical equilibrium of forces.
Also, homeostasis cannot contradict the principles of physics. It can only adapt to physical laws. Think of yourself swimming in the sea. Physics says that you should float, but you need to expend some energy to maintain a homeostatic condition in which your head stays above the water. Now, suppose that your feet get entangled with something heavy. Then, physics says that you should sink. Yet, you can expend more energy, swim harder, and still keep your head above the water - again it is homeostasis. But, if nothing changes, at some moment you'll run out of energy, you get tired and you can't keep homeostasis any more. At this point, physics takes over and you sink, and you drown. It is the typical behavior of complex systems. They can maintain homeostasis for a while, as long as they have resources to expend for this purpose.
Something similar occurs for human societies. When there is a forcing, say, an epidemics that kills a lot of people, societies react by generating more children. Look at the demographic statistics for our societies: there is a dip in numbers for the world wars, but it is rapidly compensated by more births afterward. Also in Roman times there were epidemics and the eruption of the Vesuvius that killed a lot of people. But those were small forcings that the Roman society could compensate.
Not all forcings can be compensated, but we know that the Romans were not destroyed by an asteroid that fell into the Mediterranean Sea. It might have happened, and in that case there would have been no feedback able to keep the empire together. We would have a single cause for the disappearance of the Roman Empire and everybody would agree on that. But that has not happened, of course. Perhaps, something like that has happened to the Cretan civilization; destroyed by a volcanic eruption - but that's another story.
So, in Tainter's view there is this feedback relationship between complexity and energy. At least the way I interpret it. Complexity feeds on energy and also strains the availability of energy. It is feedback. And not just energy; resources in general. So, I think that Tainter is right in refusing a simple explanation like "resource depletion is the cause of the fall of the Roman Empire". But, clearly, resources are an important part of his model. I think Tainter had in mind the Roman Empire when he developed this model, but it is of quite general validity. If this is the way things stand, his model is not in contrast with the models we have that see resource depletion as the main factor that causes collapse. But not the only cause. We must see collapse as something dynamic, and now I'll try to explain just that.
Dynamic models of collapse
Once we start reasoning in terms of complexity, we immediately see the relationship of Tainter's model with other models. I can cite John Greer's theory of "catabolic collapse" but we can go directly to the mother of all theories based on feedback: the study called "The Limits to Growth" that appeared for the first time in 1972.
As we know, "The Limits to Growth" was not about the fall of the Roman Empire. The authors tried to describe our contemporary world, but the model they used is very general and perhaps we can apply it also to the Roman Empire. So, first of all, we need to understand how the model works. Let me show you a simplified graphic representation of the model
![]()
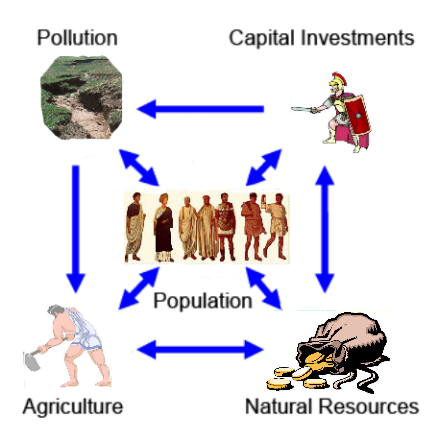
This image was made by Magne Myrtveit a few years ago and I think it nicely summarizes the main elements of the world model used for the Limits to Growth studies.
There is this problem with dynamic models; they are often very complex and difficult to understand. They use a graphical formalism, but if you look at one of these models made - for instance - using the "Stella" or "Vensim" software, all what you see is a jumble of boxes and arrows. If you are not trained in this kind of things, you can't understand what the model is about. Personally, often I find that the equations are clearer than all those boxes and arrows.
So, we need something more graphical, easier to understand, especially if we have to show these things to politicians. And, as I said, I think that Myrtveit has struck the right balance here: this graphic is "mind sized" (I am using a term from Seymour Paypert, who invented the "logo" programming language). It is mind sized because I think that you can make sense of this diagram in a few minutes. There remains a problem with politicians. Their attention span is more of the order of thirty seconds or less. But that is another problem.
So, Myrtveit's image shows us the major elements of the world model - the model of The Limits to Growth" - and their relationships. You see population, agriculture, natural resources, pollution and capital· Five main elements of the model; each one is rather intuitive to understand. What is important is the feedback relationship that exists among these elements. Perhaps the most important feedback loop is the one between capital and natural resources. Here is how the authors of "The Limits to Growth" have described this relationship:
The industrial capital stock grows to a level that requires an enormous input of resources. In the very process of that growth it depletes a large fraction of the resources available. As resource prices rise and mines are depleted, more and more capital must be used for obtaining resources, leaving less to be invested for future growth. Finally investment cannot keep up with depreciation, and the industrial base collapses, taking with it the service and agricultural systems, which have become dependent on industrial inputs.
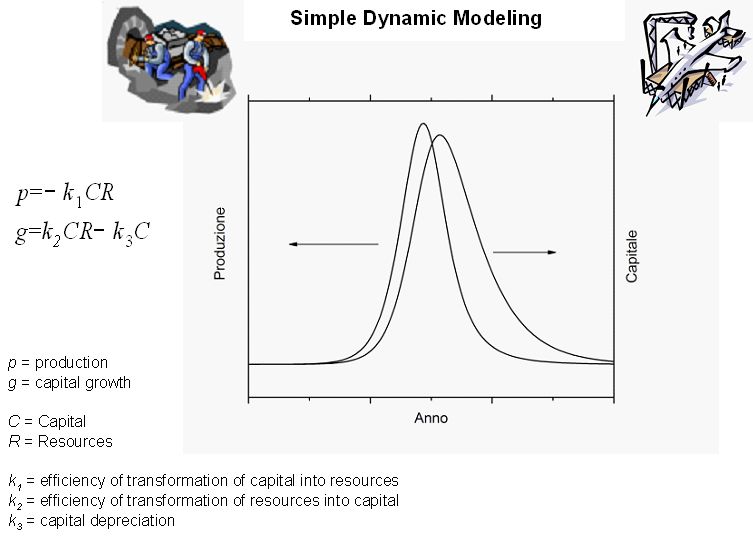
Considering just two elements, instead of five, is not in contradiction with the more complex model. It makes sense especially when you are not considering a whole empire but something more limited, for instance the oil industry. Here are the results of this approach, this time with the equations written in clear.
![]()
You see that we obtain "bell shaped" curves. We do see bell shaped curves whenever a natural resource is exploited in a free market conditions. The "Hubbert curve" for oil production is just one case. There are many others. The curve is the result of a phenomenon called overexploitation or overshoot that leads to destroy even resources which are in principle renewable. The story of whaling in 19th centuries is typical and I wrote a paper on that - I am writing another one. It is a fascinating subject: whales are a renewable resource, of course, because they reproduce. But they were hunted so efficiently that, by end 19th century, it is estimated that in the Oceans there were only 50 females left of the species that was most hunted: the "right whale." ("right" is because it was easy to kill, of course nobody had asked the opinion of whales on this name).
If you consider all five elements, things become more complex, but the general approach doesn't change that much. You can play a game with the scheme in Myrtveit's figure and you can relate it to what Tainter said about human societies. You remember that Tainter says that if a crisis emerges, society will try to cope with it. From the scheme, you can see what happens as time goes by and as people do things to avoid collapse.
So, suppose that pollution becomes a serious problem. Let's imagine that fumes from smokestacks are killing people; then society will allocate some capital to reduce fumes. Say, they would place filters on smokestacks. But filters need energy and natural resources to be built and that will place some further strain on natural resources. That will put strain on capital - so, fighting pollution may accelerate collapse, but not fighting it may cause collapse as well, although for different reasons - because pollution kills people and that makes it more difficult to generate capital and so on. You see how it works.
Let's make another example. Suppose that population grows to the point that there is not enough food for everybody. In response, society will use a fraction of its natural resources to produce fertilizers which will increase the yield of agriculture. That, however, will create a further increase in population that will put further strain on population and generate more pollution. That, in turn, will put new strain on capital and resources, and so on... Within limits, society can always adapt in this way - it is homeostasis, as I said. But only within limits.
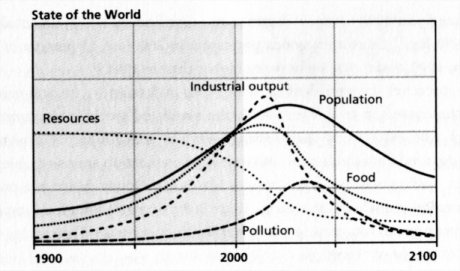
You can play this kind of game in various ways. The five elements figure by Magne Myrtveit is a good tool to gain a feeling of how society reacts to external interventions and how it evolves with the gradual depletion of natural resources. If these resources are non renewable, as it is the case of our mineral resources, eventually, the amount of capital that can be created and maintained must go down - it is one of the possible causes of collapse. Probably the most common. But in order to see how it is going to happen, you need to run the model in a computer and see what you get. Here are typical results, from the 2004 edition of "The Limits to Growth".
![]()
This is called the "standard run" or the "base case" scenario. It is a run of the model with the parameters most closely fitting the present situation. You see collapse occurring - it is when you see industrial and agricultural production crashing down. As you can see, the more complex model still produces bell shaped curves, although non symmetric ones.
Note that the model doesn't have a "complexity" parameter built in. However, it is clear that when the industrial and the agricultural system cease to function it is complexity going down (and population as well, of course). So, in a certain sense, the "Limits to Growth" model is compatible with Tainter's model - or so I tend to see things.
Of course, you don't have to take this scenario as a prophecy. It is just a mental tool designed to amplify your understanding of the system. You can change the parameters and the assumptions - collapse can be postponed, but the model is very robust. An important point is that these bell shaped curves are typical and are always the result, unless you use very specific assumptions in input, usually assuming human intervention to avoid collapse.
People are very good at optimizing exploitation. The problem is that they exaggerate and take out of the system more than what the system can replace. And that is the reason of the curve. First you go up because you are so good at exploiting the resource; then you go down because you have exploited it too much. In the middle, there has to be a peak -it is "peak-resource". In the case of crude oil, people speak of "peak oil". In the case of a whole civilization, we may speak of "peak civilization". And, as we said before, peak civilization also corresponds to "peak complexity", in the sense that Tainter described.
One last point, here. Collapse is not irreversible. Society goes in overshoot, then collapses, but the collapse gives time to the overexploited resource to reform, so growth can restart after a while. Homeostasis is like orbiting around an equilibrium point, without ever reaching it. It is a cycle that may keep going up and down, or may dampen out to reach an approximately stable state. That is, if the resource is renewable. If it is not, like oil or uranium, when it is used up, there is no more. In this case, there is no return from collapse. Also, from the viewpoint of a human being, even a reversible collapse that involves society as a whole tends to last much longer than a human lifetime. So, for what we are concerned, collapse is irreversible if we are caught by it and is something that we don't like, clearly. So we set up things like ASPO and TOD to see if we can convince politicians to do something to avoid collapse. Whether we'll succeed is another matter, but let's not go into that now.
The dynamic fall of the Roman Empire
Now we know that we should expect to see these bell curves in the behavior of a complex civilization or an empire. So, we can try to give a look to the Roman Empire in this perspective and see if it agrees with an interpretation based on system dynamics. So, first of all, let me propose a simplified model based on the same scheme that Magne Myrtveit proposed for our world as described in "The Limits to Growth".
![]()
Please do not take it as anything more than a sketch, but it may be helpful for us to understand the mechanism that lead the Empire to collapse.
Now, let me try to explain how this scheme could work. We know that the Roman Empire was based mainly on two kinds of resources: military and agricultural. I put the image of a legionnaire for "capital resources" because legions can be seen as the capital of the Roman Empire; military capital. This capital, legions, would be built on a natural resource that was mainly gold. The legions didn't mine gold, they took it from the people who had mined it (or had stolen it from somebody else).
This feedback between military capital and gold is a point that is very well described by Tainter in his book. You can read how military adventures played a fundamental role in the growth of the empire, and earlier on of the Roman Republic. There was a clear case of positive feedback. The Empire would defeat a nearby kingdom, rob it of gold and take part of the population as slaves. Gold could be used to pay for more legions and go on conquering more lands. Positive feedback: the more legions you have, the more gold you can rob; the more gold you have, the more legions you can create. And so on...
One of the inventions of the Roman was their capability of transforming gold into legions and legions into gold - as I said it is a very clear case of feedback. Still today we use the word "soldier", which comes from Latin, and it means "hired" or "salaried". It was not only gold, legionnaires were also paid in silver, but the concept remains the same. Legions paid for the salaries of the legionnaires using the profit they made from looting the conquered lands.
But, as conquest proceeded, soon the Romans found themselves without easy lands to conquer. It was a problem of EROEI; energy return on energy invested. In this case, GROGI (gold return on gold invested). After the easy conquests of the 1st century b.c., Gallia for instance, then things became difficult. The energy yield of conquering new lands went down. On the North East, the Germans were too poor - and also warlike. Conquering them was not only difficult, but didn't generate a profit. In the East, the Parthians were rich, but militarily powerful. Then on the West there was the Atlantic Ocean, the North was too cold, the south too dry. Negative feedback, you see?
With the legions not bringing any more gold, gold disappeared from the Empire for various reasons. In part it was to buy luxury items that the Empire couldn't manufacture inside its borders, silk for instance. In part, it disappeared because barbarian chieftains were paid not to invade the Empire or to fight alongside with the Romans. There were other reasons, but anyway gold was a dwindling resource for the Roman Empire, a little like our "black gold", petroleum. During the good times, the legions would bring back from foreign conquests more gold than what was spent but, with time, the balance had become negative.
Of course, military conquest was not the only source of gold for Rome. As I said, we are describing a complex system, and complex systems have many facets. So, the Romans had gold mines in Africa and in Spain. And they also had silver mines in Spain. There are no mines in the scheme; we could add mines to it, that wouldn't be a problem. But the problem here is that we don't have enough data to understand exactly the role of mines in the economy of the Roman Empire. We know, for instance, that silver mining declined in Spain with the decline of the empire. Did mining decline cause the collapse of the empire? Personally, I think not. At least, the Romans had started their expansion much earlier than they had conquered Spain and these mines. At the time of the wars with Carthage, it was the Carthaginians who held Spain and, I imagine, the silver mines. But this silver didn't help them much, since they lost the war and were wiped out by the Romans. So, we should be wary of single explanations for complex events. We can only say that mines are subjected to the same kind of negative feedback that affects military conquests. After you exploit the easy ores (or lands to be conquered) you are left with difficult ores (or lands) that don't yield the same profit. It is negative feedback, again.
Then, there was agriculture. Surely it was an important economic activity of the Roman Empire, as you can read, again, in Tainter's book. Agriculture is also subjected to positive and negative feedbacks as you can see in the scheme. With good agriculture, the population increases. With more population, you can have more farmers. In the case of the Roman Empire, as population grows, you can have also more legions which will bring back home slaves which can be put to work in the fields. But agriculture has also a negative feedback, and that is erosion.
You can see erosion in the scheme listed as "pollution". It affects agriculture negatively. It reduces population and sets everything backwards: negative feedback, again. The more you try to force agriculture to support a large populations (including the legions) the more strain you put on the fertile soil. Fertile soil is a non renewable resource; it takes centuries to reform the fertile soil, after that it has been lost. So, erosion destroys agriculture, population falls, you have a smaller number of legions and, in the end, you are invaded by barbarians. This is another negative feedback loop that is related to the fall of the Roman Empire.
The question of agriculture during Roman times is rather complex ad the data we have are contradictory; at least in some respects. There is clear evidence of erosion and deforestation, especially during the expansion period of the early Roman Empire. Then, during and after the third century, we have famines and plagues. These two things are related, plagues are often the result of poor nutrition. At the same time, we have evidence that the Romans of the late empire were unable to exploit in full the land they had. It is reported that plenty of land was not cultivated - apparently for lack of manpower. We also know that forests were returning with the 4th century a.d. So, there are various elements of the dynamic scheme which connect with each other. Apparently, the emphasis on military power took away resources from agriculture and ingenerated still another negative feedback: not enough people (or slaves) to cultivate the land. But it may also be that some areas of land were not cultivated because erosion had ruined them.
So, I have proposed to you a scheme and I described how it could work. But does it work? We should now compare the scheme with real data; fit the data to a model. The problem is that we don't have enough data to fit - we probably never will. So, I didn't try fitting anything; but I think I can show you some sets of data that are an impressive indication that there is something true in this dynamical model.
First of all, if the decline and fall of the Roman Empire has been a case of overexploitation of resources, we should expect to see bell curves for industrial and agricultural production, for population, and for other parameters. As I said, the historical data are scant, but we have archaeological data. So, let me show a plot that summarizes several industrial and agricultural indicators, together with a graph that shows how the extension of the Empire varied in time. It is taken from In search of Roman economic growth, di W. Scheidel, 2007" The other graph is taken from Tainter's book.
![]()
Especially the upper graph is impressive. There has been a "peak-empire", at least in terms of production and agriculture, somewhere around mid 1st century. Afterward, there was a clear decline - it was not just a political change. It was also a real reduction in complexity as Tainter defines collapse. The Roman Empire really collapsed in mid 3rd century. It had a sort of "Hubbert peak" at that time.
The other parameter shown in the figure, the extension of the empire, also shows an approximately bell shaped curve. The Empire continued to exist as a political entity even after it had been reduced to an empty shell in economic terms. If we think that the extension of the empire is proportional to the "capital" accumulated, then this relationship makes sense if we think of the dynamic model that we saw before. Capital, as we saw, should peak after production. This is a bit stretched as an interpretation, I admit. But at least we see also here a bell shaped curve.
There is more. Do you remember the curves that are calculated in the dynamic model for the relation Capital/resources? You expect the production curve to peak before the capital curve. Now, I proposed that this relation capital/resources exists between the Roman Army and the gold that they looted. So, do we have data that show this relationship?
Yes, we do, although only approximately. Let's first see the data for gold. We don't have data for the amount of gold circulating within the Empire, but Tainter shows us the data for the devaluation of the Roman silver coin, which we would expect to follow the same path. Here are the data (the figure is taken from this site ):
![]()
Now, the amount of precious metal within a denarius is not a precise measurement of the total gold or silver in the Empire, but it is at least an indication that this amount was going down after the first century A.D. And, since the Romans had started poor, earlier on, there must have been a peak at some time, "peak gold", probably in the 1st century a.d.
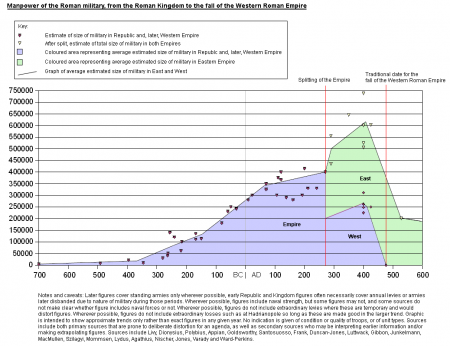
About the size of the Roman Army, we have this figure from Wikipedia . As you see, the data are uncertain, but if we consider the Western Empire only, there was a peak around 3rd century a.d.
![]()
So, you see? Army and gold show the correct relationship that we expect to have between capital and resource. they both peak, but gold peaks before the army. The Romans kept increasing the size of their army even after the economic returns that they got from military activities went down, actually may have become negative. It is exactly the same behavior of whalers in 19th century who kept increasing the size of the whaling fleet even it was clear that there weren't enough whales to catch to justify that. I think this is an impressive result. At least, it convinced me.
There is more if we look at the Roman population curve, although for this we must rely on very uncertain data (see, e.g. the paper by Walter Schneidel . I can't show you a graph, here, too uncertain are the data. But it seems that, in any case, there was a population peak in the Roman Empire around mid 2nd century. If this is the case, the Roman population peak arrives after the production peak - just as shown in the "standard run" calculations for the world3 model.
So, I think we have enough data, here, to prove the validity of the model - at least in qualitative terms. Maybe somebody should collect good data, archaeological and historical, and made a complete dynamic model of the Roman Empire. That would be very interesting, but it is beyond my possibilities for now. Anyway, even from these qualitative data we should be able to understand why the Empire was in trouble. One of the main causes of the trouble was that it had this big military apparatus, the legions, that needed to be paid and didn't bring in any profit. It was the start of an hemorrhage of gold that couldn't be reversed. In addition, the Empire bled itself even more by building an extensive system of fortifications - the limes that had to be maintained and manned, besides being expensive in themselves.
The story of the fortifications is a good example of what we had said; the attempt of a complex system to maintain homeostasis. The Romans must have understood that legions were too expensive if you had to keep so many of them to keep the borders safe. So, they built these walls. I imagine that the walls were built by slaves; and a slave surely cost less than a legionnaire. Slaves, however, were not good as fighters - I suppose that if you gave a sword to a slave he might think to run away or to use it against you. You know the story of Spartacus, the leader of a slave revolt in Roman times. I am sure that the Romans didn't want to risk that again. But with walls the Romans had found a way to replace legionnaires with slaves. You needed less legionnaires to defend a fortification than to defend an open field. That was a way to save money, to keep homeostasis. But it wasn't enough - obviously. The Romans still needed to pay for the legions and - as a disadvantage - the walls were a rigid system of defense that couldn't be changed. The Romans were forced to man the walls all along their extension and that must have been awfully expensive. The Empire had locked itself in a cage from which it would never be able to escape. Negative feedback kills.
Military expenses were not the only cause of the fall. With erosion gnawing at agricultural yields and mine productivity going down, we should not be surprised if the empire collapsed. It simply couldn't do otherwise. So, you see that the collapse of the Roman Empire was a complex phenomenon where different negative factors reinforced each other. It was a cascade of negative feedbacks, not a single one, that brought down the empire. And this shows how closely related to the Romans we are. Surely there are differences: our society is more of a mining society and less of a military based society. We don't use slaves but, rather, machines. We also have plenty of gadgets that the Romans didn't have. But, in the end, the interactions of the various elements of our economy are not that much different. What brought down the Romans, and eventually will bring us down, is the overexploitation of the resources. If the Romans could have found a way to use their resources, agriculture for instance, in ways that didn't destroy them, erosion in this case, their society could have lasted for a longer time. But they never found an equilibrium point - they went down always using a bit too much of what they had.
Avoiding Collapse
From our viewpoint, we see what was the history of the Roman Empire. But, from inside, as we saw, it wasn't clear at all. But let's assume that someone had it clear, already at the time of Marcus Aurelius. I said that there might have been something like an ASPE; "association for the study of peak empire". Or let's imagine that a wise man, a Druid from foggy Britannia, an ancestor of Merlin the wise, was smart enough to figure out what was going on. You don't really need computers to make dynamical models, or maybe this druid made one using wooden cogs and wheels, the whole thing powered by slaves. So, let's say that this druid understood that the troubles of the Empire are caused by a combination of negative feedbacks and that these feedbacks come from the cost of the army and of the bureaucracy, the overexploitation of the fertile soil, the fact that Rome had exhausted the "easy" targets for conquest.
Now, it is a tradition of Druids (and also of ASPO) of alerting kings and rulers of the dangers ahead. After all, Merlin did that for King Arthur and we may imagine that the druid we are thinking of felt that it was his duty to do that with Emperor Marcus Aurelius. So, he decides to go to Rome and speak to the Emperor. Suppose you were that druid; what would you say to the Emperor?
Good question, right? I have asked it to myself many times. We could think of many ways of answering it. For instance, if gold is running out from the Empire's coffers, why not suggest to the Emperor to mount a naval expedition to the Americas? It is what Columbus would do, more than a millennium afterwards and the result was the Spanish empire - it was also based on gold and it didn't last for long. Maybe the Romans could have done something like that. But they didn't have the right technology to cross the oceans and, at the time of Marcus Aurelius, they had run out of the resources to develop it. So, they had to remain in Europe and to come to terms with the limits of the area they occupied. The Empire had to return its economy within these limits. So, there is only one thing that you, as the wise Druid from Britannia, can tell the Emperor: you have to return within the limits that the Empire's economy can sustain.
So you walk to Rome - kind of a long walk from Eburacum, in Britannia; a place that today we call "York". You are preceded by your fame of wise man and so the Emperor receives you in his palace. You face him, and you tell him what you have found:
"Emperor, the empire is doomed. If you don't do something now, it will collapse in a few decades"
The Emperor is perplexed, but he is a patient man. He is a philosopher after all. So he won't have your head chopped off right away, as other emperors would, but he asks you, "But why, wise druid, do you say that?"
"Emperor, " you say, "you are spending too much money for legions and fortifications. The gold accumulated in centuries of conquests is fast disappearing and you can't pay enough legionnaires to defend the borders. In addition, you are putting too much strain on agriculture: the fertile soil is being eroded and lost. Soon, there won't be enough food for the Romans. And, finally, you are oppressing people with too much bureaucracy, which is also too expensive."
Again, the Emperor considers having your head chopped off, but he doesn't order that. You have been very lucky in hitting on a philosopher-emperor. So he asks you, "Wise druid, there may be some truth in what you say, but what should I do?"
"Emperor, first you need to plant trees. the land needs rest. In time, trees will reform the fertile soil."
"But, druid, if we plant trees, we won't have enough food for the people."
"Nobody will starve if the patricians renounce to some of their luxuries!"
"Well, Druid, I see your point but it won't be easy....."
"And you must reduce the number of legions and abandon the walls!"
"But, but.... Druid, if we do that, the barbarians will invade us....."
"It is better now than later. Now you can still keep enough troops to defend the cities. Later on, it will be impossible. It is sustainable defense."
"Sustainable?"
"Yes, it means defense that you can afford. You need to turn the legions into city militias and..."
"And...?"
"You must spend less for the Imperial Bureaucracy. The Imperial taxes are too heavy! You must work together with the people, not oppress them! Plant trees, disband the army, work together!"
Now, Emperor Marcus Aurelius seriously considers whether it is appropriate to have your head chopped off, after all. Then, since he is a good man, he sends to you back to Eburacum under heavy military escort, with strict orders that you should never come to Rome again.
This is a little story about something that never happened but that closely mirrors what happened to the modern druids who were the authors of "The Limits to Growth." They tried to tell to the world's rulers of their times something not unlike what our fictional druid tried to tell to Emperor Marcus Aurelius. The heads of the authors of "The Limits to Growth" weren't chopped off, but they were surely "academically decapitated" so to say. They were completely ignored. Not just ignored, ridiculed and vituperated. It is not easy to be a druid.
So, here we found another similarity between our times and the Roman ones. We are subjected to the "fish in the water" curse. We don't understand that we are surrounded by water. And we don't want to be told that water exists.
As things stands, we seem to be blithely following the same path that the Roman Empire followed. Our leaders are unable to understand complex systems and continue to implement solutions that worsen the problem. As the wise druid was trying to tell to Marcus Aurelius, building walls to keep the barbarians out was a loss of resources that was worse than useless. But I can see the politicians of the time running on a platform that said, "Keep the barbarians out! More walls to defend the empire". It is the same for us. Tell a politician that we are in trouble with crude oil and he/she will immediately say "drill deeper!" or "drill, baby, drill!" Negative feedback kills.
But I would like to point out to you something: let's go back to what our fictional druid was telling to Emperor Aurelius. He had this slogan "Plant trees, disband the army and work together". I had invented it in a post that I had written on the collapse of Tuscan society in 16th century; it is another story but one that shows how all societies follow similar paths. Anyway, can you see what kind of world the Druid was proposing to the Emperor? Think about that for a moment: a world of walled cities defended by city militias, no central authority or a weak one, an economy based on agriculture.
Do you see it.....? Sure, it is Middle Ages! Think about that for a moment and you'll see that you could define Middle Ages as a solution for the problems of the Roman Empire!
So, our Druid had seen the future and was describing it to Emperor Aurelius. He had seen the solution of the problems of Empire: Middle Ages. It was where the Empire was going and where it could not avoid going. What the Druid was proposing was to go there in a controlled way. Ease the transition, don't fight it! If you know where you are going, you can travel in style and comfort. If you don't, well, it will be a rough ride.
We may imagine a hypothetical "driven transition" in which the government of the Roman Empire at the time of Marcus Aurelius would have done exactly that: abandon the walls, reduce the number of legion and transform them into city militias, reduce bureaucracy and Imperial expenses, delocalize authority, reduce the strain on agriculture: reforest the land. The transition would not have been traumatic and would have involved a lower loss of complexity: books, skills, works of art and much more could have been saved and passed to future generations.
All that is, of course, pure fantasy. Even for a Roman Emperor, disbanding the legions couldn't be easy. After all, the name "Emperor" comes from the Latin word "imperator" that simply means "commander". The Roman Emperor was a military commander and the way to be Emperor was to please the legions that the Emperor commanded. A Roman Emperor who threatened to disband the legions wouldn't have been very popular and, most likely, he was to be a short lived Emperor. So, Emperors couldn't have done much even if they had understood system dynamics. In practice, they spent most of their time trying to reinforce the army by having as many legions as they could. Emperors, and the whole Roman world, fought as hard as they could to keep the status quo ante , to keep things as they had always been. After the 3rd century crisis, Emperor Diocletian resurrected the Empire transforming it into something that reminds us of the Soviet Union at the time of Breznev. An oppressive dictatorship that included a suffocating bureaucracy, heavy taxes for the citizens, and a heavy military apparatus. It was such a burden for the Empire that it destroyed it utterly in little more than a century.
Our Druids may be better than those of the times of the Roman Empire, at least they have digital computers. But our leaders are no better apt at understanding complex system than the military commanders who ruled the Roman Empire. Even our leaders were better, they would face the same problems: there are no structures that can gently lead society to where it is going. We have only structures that are there to keep society where it is - no matter how difficult and uncomfortable it is to be there. It is exactly what Tainter says: we react to problems by building structure that are more and more complex and that, in the end, produce a negative return. That's why societies collapse.
So, all our efforts are to keep the status quo ante . For this reason we are so desperately looking for something that can replace crude oil and leave everything else the same. It has to be something that is liquid, that burns and, if possible, even smells bad. Drill more, drill deeper, boil tar sands, make biofuels even if people will starve. We do everything we can to keep things as they are.
And, yet, we are going where the laws of physics are taking us. A world with less crude oil, or with no crude oil at all, cannot be the same world we are used to, but it doesn't need to be the Middle Ages again. If we manage to deploy new sources of energy, renewable or nuclear - fast enough to replace crude oil and the other fossil fuels, we can imagine that the transition would not involve a big loss of complexity, perhaps none at all. More likely, a reduced flux of energy and natural resources in the economic system will entail the kind of collapse described in the simulations of "The Limits to Growth." We can't avoid to go where the laws of physics are taking us.
Conclusion: showdown at Teutoburg
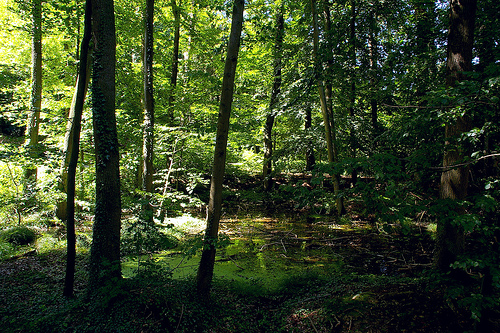
Two thousand years ago, three Roman legions were annihilated in the woods of Teutoburg by a coalition of tribes of the region that the Romans called "Germania". Today, after so many years, the woods of the region are quiet and peaceful places, as you can see in this picture
![]()
It is hard for us to imagine what the three days of folly of the battle of Teutoburg must have been. The legions surprised by the ambush of the Germans, their desperate attempt to retreat: under heavy rain and strong winds in the woods, they never were able to form a line and fight as they were trained to. One by one, almost all of them were killed; their general, Varus, committed suicide. The Germans left the bodies rotting in the woods as a sort of sacred memory to the battle. The ultimate disgrace for the legions was the loss of their sacred standards. It was such a disaster that it led to the legend that Emperor Augustus would wander at night in his palace screaming "Varus, give me back my legions!"
I think we could pause for a moment and remember these men, Germans and Romans, who fought so hard and died. We have seen so many similarity between our world and the Roman one that we may feel something that these men felt as well. Why did they fight, why did they die? I think that many of them fought because they were paid to fight. Others because their commander or their chieftain told them so. But, I am sure, a good number of them had some idea that they were fighting for (or against) the abstract concept that was the Roman Empire. Some of them must have felt that they stood for defending civilization against barbarians, others for defending their land against evil invaders.
Two millennia after the battle of Teutoburg, we can see how useless it was that confrontation in the woods soaked with rain. A few years later, the Roman general Germanicus, nephew of Emperor Tiberius, went back to Teutoburg with no less than eight legions. He defeated the Germans, recovered the standards of the defeated legions, and buried the bodies of the Roman dead. Arminius, the German leader who had defeated Varus, suffered a great loss of prestige and, eventually, he was killed by his own people. But all that changed nothing. The Roman Empire had exhausted its resources and couldn't expand any more. Germanicus couldn't conquer Germany any more than Varus could bring back his legions from the realm of the dead.
Civilizations and empires, in the end, are just ripples in the ocean of time. They come and go, leaving little except carved stones proclaiming their eternal greatness. But, from the human viewpoint, Empires are vast and long standing and, for some of us, worth fighting for or against. But those who fought in Teutoburg couldn't change the course of history, nor can we. All that we can say - today as at the time of the battle of Teutoburg - is that we are going towards a future world that we can only dimly perceive. If we could see clearly where we are going, maybe we wouldn't like to go there; but we are going anyway. In the end, perhaps it was Emperor Marcus Aurelius who had seen the future most clearly:
Nature which governs the whole will soon change all things which thou seest, and out of their substance will make other things, and again other things from the substance of them, in order that the world may be ever new.
Marcus Aurelius Verus - "Meditations" ca. 167 A.D.
![]()


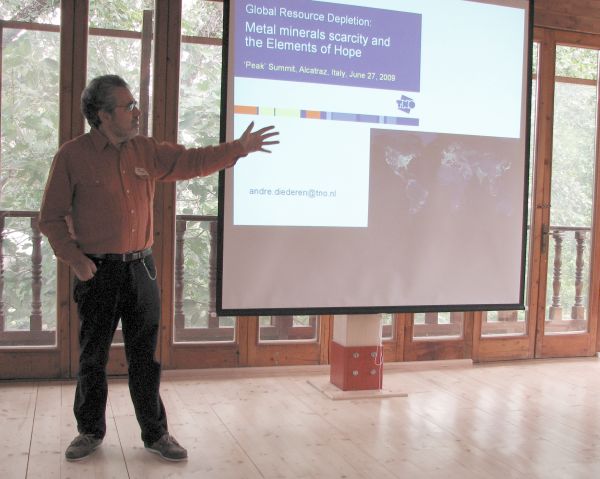 This text describes the presentation that I gave at the "Peak Summit" in Alcatraz (Italy) on June 27, 2009 (the picture shows me speaking there). It is not a transcription, but something that I wrote from memory, mostly in a single stretch, while I had it still fresh in my mind. The result is that my 40 minutes talk became a text of more than 10,000 words, much longer than a typical internet document (but still less than Gibbon's six volumes on the same subject!) A talk, anyway, can be longer and more effective than a post, mostly because the people listening to you are not distracted by the infinite distractions of an internet connection. So, I wrote this post trying to maintain the style of an oral presentation. I don't know if it will turn out to be more easily readable than the usual style but, if you arrive to the end, you'll tell me what you think of it.
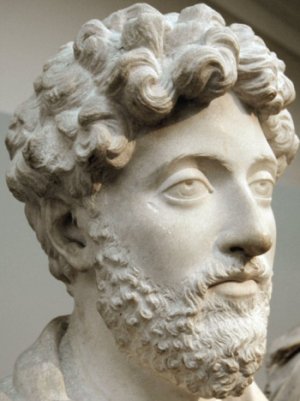
 Of course that is not a movie that pretends to be historically accurate, but it is fun to think that after so many years we are still interested in the last years of the Roman Empire - it is a subject of endless fascination. Even the book by Namatianus has been transformed into a movie, as you can see in the figure. It is a work of fantasy, but they have tried to be faithful to the spirit of Namatianus' report. It must be an interesting movie, but it has been shown only in theaters in Italy, and even there for a very short time; so I missed it. But let's move on.
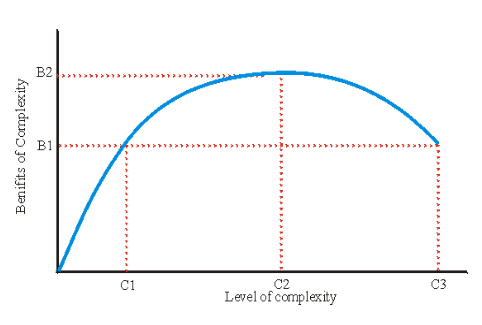


Of course your content has to be amazing and needs a few backlinks from industry leaders or authority sites. Also the most important part of your blog post is the bottom section where you have your call to action to convert the reader into a subscriber, so don't ever use a generic click here type CTA.
E.g. If your blog post is about 10 ways to lose weight, then add a resource box below which says "It's time to get started, download this FREE time-line pdf I prepared for you which helped me and 1000 members of this website lose over 10 lbs in 22 days" and bam.. there you have a new signup!
P.S. Goes without saying but you must give good advice. You have to win their trust, the article, the pdf must give them what they're searching for (give them 80% and remaining 20% after payment).